

USD/CAD rallies to three-week high as BoC’s dovish stance
- USD/CAD climbs above 1.3588, fueled by BoC Governor Macklem's dovish comments and falling oil prices from Tropical Storm Francine.
- BoC hints at more aggressive rate cuts as Canadian economy slows and unemployment hits a seven-year peak.
- Investors anticipate US CPI data, which could bolster expectations for a Fed rate cut at the upcoming September 17-18 meeting.
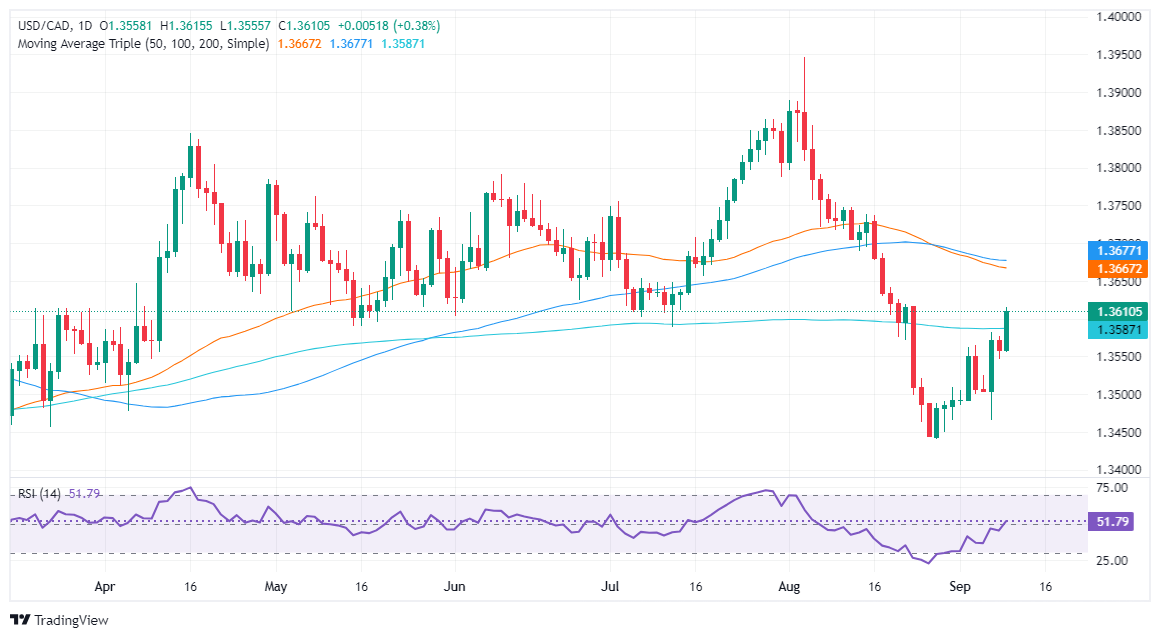
The USD/CAD rallied to a three-week high above the 200-day moving average (DMA) of 1.3588, gaining 0.36% after bouncing off the daily lows of 1.3553. The rally was weighed by the dovish comments of Bank of Canada (BoC) Governor Tiff Macklem and the drop in oil prices. At the time of writing, the pair trades at 1.3608.
USD/CAD climbs and surpasses 200-DMA, on BoC comments
Wall Street ended Tuesday’s session with gains, while the US Dollar clings to minimal gains of 0.06%, according to the US Dollar Index (DXY), trading at 101.67.
BoC’s Governor Macklem stated that deeper rate cuts could be appropriate and added that shifts in global trade may drive up prices.
In the meantime, the impact of tropical storm Francine sponsored a leg-down in oil prices as oil and gas producers shut off most installations as the storm advanced toward landfall in Louisiana.
The Canadian Dollar weakened since the Bank of Canada (BoC) was the first major central bank to slash rates amid fears of an economic slowdown. Last week, Canada’s unemployment rate climbed to 6.6%, the highest in seven years, excluding the two years of the COVID-19 pandemic.
On the US front, investors are eyeing the release of the Consumer Price Index (CPI) in August, which is expected to confirm that the Federal Reserve might begin to cut rates at the upcoming September 17-18 monetary policy meeting.
USD/CAD Price Forecast: Technical outlook
From a technical perspective, the USD/CAD remains neutral biased, even though the pair has cracked the 200-day moving average (DMA) at 1.3589 and achieved a daily close above the latter.
Short term, momentum is tilted to the upside, though for a bullish continuation, the USD/CAD must clear key resistance levels. The next ceiling level will be August 22 and 23 highs at 1.3618, followed by the confluence of the 50 and 100-DMAs around 1.3667/75.
On the downside, the path of least resistance sees the first support at 1.3550. A breach of this level would expose 1.3500, followed by the September 6 low at 1.3465.
Canadian Dollar FAQs
The key factors driving the Canadian Dollar (CAD) are the level of interest rates set by the Bank of Canada (BoC), the price of Oil, Canada’s largest export, the health of its economy, inflation and the Trade Balance, which is the difference between the value of Canada’s exports versus its imports. Other factors include market sentiment – whether investors are taking on more risky assets (risk-on) or seeking safe-havens (risk-off) – with risk-on being CAD-positive. As its largest trading partner, the health of the US economy is also a key factor influencing the Canadian Dollar.
The Bank of Canada (BoC) has a significant influence on the Canadian Dollar by setting the level of interest rates that banks can lend to one another. This influences the level of interest rates for everyone. The main goal of the BoC is to maintain inflation at 1-3% by adjusting interest rates up or down. Relatively higher interest rates tend to be positive for the CAD. The Bank of Canada can also use quantitative easing and tightening to influence credit conditions, with the former CAD-negative and the latter CAD-positive.
The price of Oil is a key factor impacting the value of the Canadian Dollar. Petroleum is Canada’s biggest export, so Oil price tends to have an immediate impact on the CAD value. Generally, if Oil price rises CAD also goes up, as aggregate demand for the currency increases. The opposite is the case if the price of Oil falls. Higher Oil prices also tend to result in a greater likelihood of a positive Trade Balance, which is also supportive of the CAD.
While inflation had always traditionally been thought of as a negative factor for a currency since it lowers the value of money, the opposite has actually been the case in modern times with the relaxation of cross-border capital controls. Higher inflation tends to lead central banks to put up interest rates which attracts more capital inflows from global investors seeking a lucrative place to keep their money. This increases demand for the local currency, which in Canada’s case is the Canadian Dollar.
Macroeconomic data releases gauge the health of the economy and can have an impact on the Canadian Dollar. Indicators such as GDP, Manufacturing and Services PMIs, employment, and consumer sentiment surveys can all influence the direction of the CAD. A strong economy is good for the Canadian Dollar. Not only does it attract more foreign investment but it may encourage the Bank of Canada to put up interest rates, leading to a stronger currency. If economic data is weak, however, the CAD is likely to fall.
Artigos Recomendados


