NZD/USD Price Analysis: New Zealand Dollar weakens ahead of Q1GDP

Fonte Fxstreet
  • NZD/USD falls to near 0.6130 as the New Zealand Dollar exhibits weakness ahead of the Q1 GDP data.
  • The USD Index holds its immediate support of 105.00 in a holiday market mood.
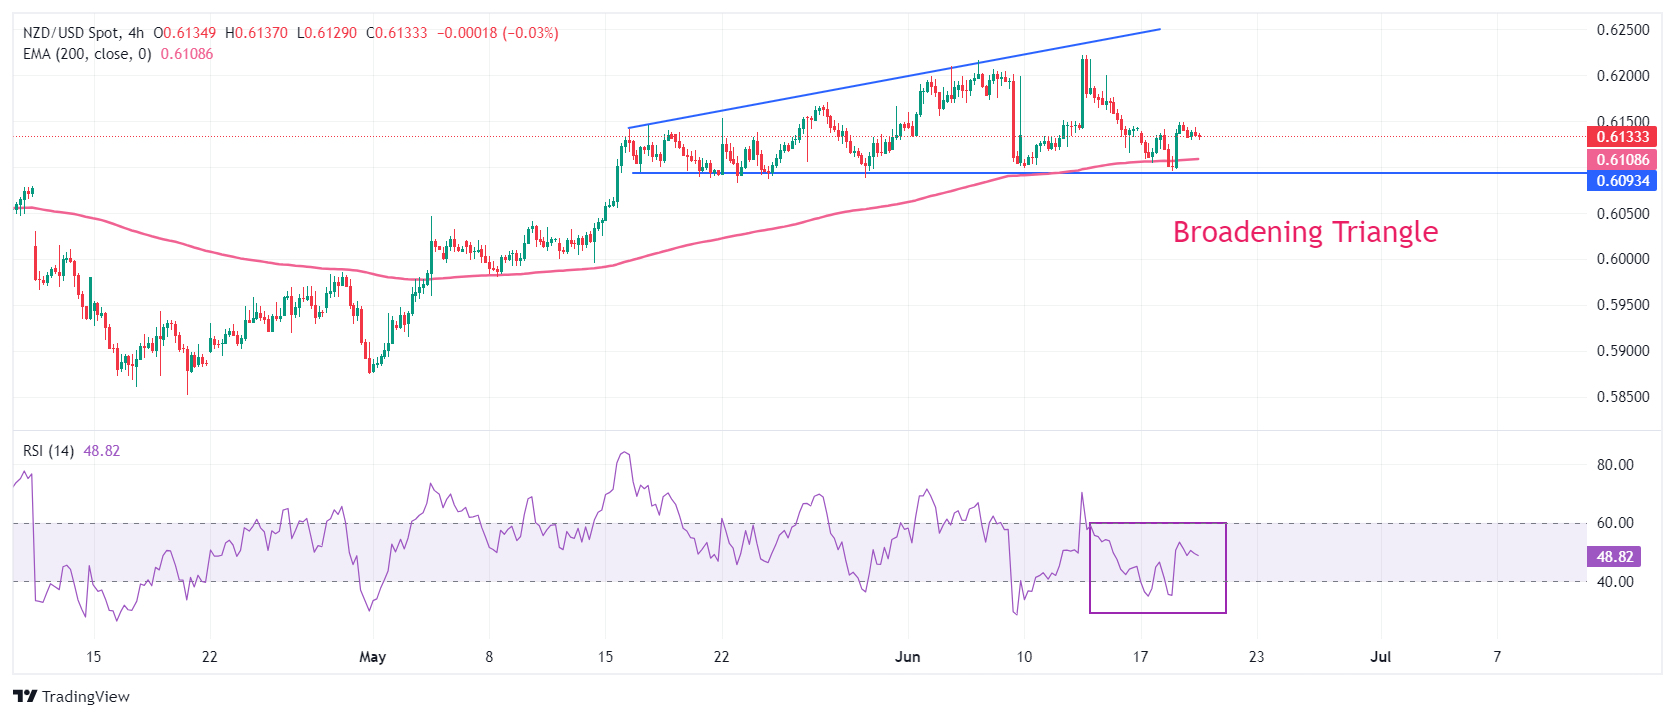
  • NZD/USD declines toward the horizontal support of the Broadening Triangle pattern.

The NZD/USD pair slumps to near 0.6130 in Wednesday’s American session. The Kiwi asset drops as the New Zaland Dollar comes under pressure ahead of the New Zealand (NZ) Q1 Gross Domestic Product (GDP) data, which will be published on Thursday. The NZ economy is estimated to have remained stagnant.

Weak economic performance would boost expectations of early rate cuts by the Reserve Bank of New Zealand (RBNZ). The RBNZ has been keeping its Official Cash Rate (OCR) higher at 5.5% for more than a year due to stubborn inflationary pressures.

Meanwhile, the US Dollar (USD) edges down in a thin volume trading session due to a holiday in United States (US) markets on account of Juneteenth. The US Dollar Index (DXY) holds its crucial support of 105.00. However, the near-term outlook has become uncertain as market participants expect the Federal Reserve (Fed) to cut interest rates twice this year.

This week, the US Dollar will be guided by preliminary S&P Global PMIs for June, which will be published on Thursday. The agency is expected to show a decline in the Composite PMI due to weakness in manufacturing as well as the service sector.

NZD/USD trades in a Broadening Triangle chart pattern on a four-hour timeframe in which the downside remains cushioned with the horizontal support, which is plotted from May 16 low around 0.6100. While the upside in the above-mentioned chart formation remains limited to the upward-sloping border, which in this case is marked from May 16 high around 0.6140.

The 200-period Exponential Moving Average (EMA) near 0.6101 continues to provide support to the New Zealand Dollar bulls.

The 14-period Relative Strength index (RSI) hovers near 40.00. A break below the same will trigger a bearish momentum.

Fresh downside would appear if the asset delivers a decisive break below the round-level support of 0.6100. This would drag the asset towards April 4 high around 0.6050 and psychological support of 0.6000.

On the contrary, a reversal move above June 12 high of 0.6222, which will expose the asset January 15 high near 0.6250, followed by January 12 high near 0.6280.

NZD/USD four-hour chart
NZD/USD

Overview
Today last price 0.6134
Today Daily Change -0.0009
Today Daily Change % -0.15
Today daily open 0.6143
 
Trends
Daily SMA20 0.6146
Daily SMA50 0.605
Daily SMA100 0.607
Daily SMA200 0.6063
 
Levels
Previous Daily High 0.6149
Previous Daily Low 0.6096
Previous Weekly High 0.6222
Previous Weekly Low 0.6099
Previous Monthly High 0.6171
Previous Monthly Low 0.5875
Daily Fibonacci 38.2% 0.6129
Daily Fibonacci 61.8% 0.6116
Daily Pivot Point S1 0.611
Daily Pivot Point S2 0.6076
Daily Pivot Point S3 0.6057
Daily Pivot Point R1 0.6163
Daily Pivot Point R2 0.6182
Daily Pivot Point R3 0.6216


Isenção de responsabilidade: Apenas para fins informativos. O desempenho passado não é indicativo de resultados futuros.
placeholder
O preço do ouro interrompe seu avanço depois de atingir um recorde de alta devido à alta dos rendimentos dos EUAOs preços do ouro atingiram outro recorde de alta durante a sessão norte-americana de segunda-feira, mas interromperam seu avanço em meio aos rendimentos elevados dos títulos do Tesouro dos EUA e a um dólar forte.
Autor  FXStreet
Ontem 02: 29
Os preços do ouro atingiram outro recorde de alta durante a sessão norte-americana de segunda-feira, mas interromperam seu avanço em meio aos rendimentos elevados dos títulos do Tesouro dos EUA e a um dólar forte.
placeholder
Quais BDRs pagam mais dividendos? E quais têm maior valorização? Veja rankingInvesting.com – O setor financeiro é o que mais paga dividendos entre companhias estrangeiras, de acordo com ranking de Brazilian Depositary Receipts (BDRs) da Grana Capital com dados da B3 (BVMF:B3SA
Autor  Investing.com
10 horas atrás
Investing.com – O setor financeiro é o que mais paga dividendos entre companhias estrangeiras, de acordo com ranking de Brazilian Depositary Receipts (BDRs) da Grana Capital com dados da B3 (BVMF:B3SA
placeholder
4 ações de varejo dos EUA que todo investidor deve ter, segundo BernsteinInvesting.com – Em uma nota recente, os analistas da Bernstein identificaram quatro ações do setor de varejo que, em sua visão, apresentam um "conjunto único de oportunidades", diante das atuais incer
Autor  Investing.com
10 horas atrás
Investing.com – Em uma nota recente, os analistas da Bernstein identificaram quatro ações do setor de varejo que, em sua visão, apresentam um "conjunto único de oportunidades", diante das atuais incer
placeholder
Ações de consumo e industriais estão mais expostas a possível choque no petróleoInvesting.com -- Ações ligadas ao consumo e ao setor industrial estão entre as mais vulneráveis a um possível choque de oferta de petróleo, afirmaram estrategistas do Barclays (LON: BARC) nesta terç
Autor  Investing.com
9 horas atrás
Investing.com -- Ações ligadas ao consumo e ao setor industrial estão entre as mais vulneráveis a um possível choque de oferta de petróleo, afirmaram estrategistas do Barclays (LON: BARC) nesta terç
placeholder
Ouro atinge recorde de alta, próximo a US$ 2.750, em meio a incertezas geopolíticas e eleições nos EUAOs preços do ouro ampliaram seus ganhos pelo quinto dia dos últimos seis e atingiram o maior valor de todos os tempos (ATH), em US$ 2.748, um pouco abaixo da marca psicológica de US$ 2.750.
Autor  FXStreet
8 horas atrás
Os preços do ouro ampliaram seus ganhos pelo quinto dia dos últimos seis e atingiram o maior valor de todos os tempos (ATH), em US$ 2.748, um pouco abaixo da marca psicológica de US$ 2.750.
Produtos relacionados
goTop
quote