

Yen slumps across the board, USD/JPY probes toward 146.00
- USD/JPY climbs further on Wednesday in a broad-market Yen selloff.
- Japanese wages plummeted in real terms, sparking a Yen weakening.
- With real wages declining, the BoJ is less likely to begin hiking rates.
The USD/JPY rose on Wednesday, tapping 145.80 as the pair grinds towards the 146.00 handle. A broad-market Japanese Yen (JPY) sell-off, sparked by a wide miss in Japanese wage figures published early Wednesday, is dragging the Yen down across the board in mid-week market action.
Japanese real wages tumble 3% despite 0.2% increase in nominal wages
Despite a 0.2% rise in nominal wages, Japanese real incomes tumbled 3% for the year ended November as inflation continues to eat away at Japanese consumers’ earnings and purchasing power.
With the Bank of Japan (BoJ) hinging rate hikes on rising real wages, odds of a tightening cycle from the Japanese central bank are evaporating, sending the Yen skidding across the floorboards and is set to spark another long-run flight out of the JPY. Despite high inflation continuing to erode real wages, the BoJ is stubbornly entrenched in a hyper easy monetary policy stance, with Japanese central planners keeping rates pinned in slightly negative territory at or near -0.1% as the BoJ fearfully looks ahead to the possibility of inflation declining too far past the 2% barrier sometime in 2025. Japanese annual inflation currently stands at 2.8% through last November, declining from a peak of 4.3% in January of last year.
Markets could see further momentum added to the USD/JPY from the Greenback side on Thursday, when the US will publish its latest Consumer Price Index (CPI) inflation figures for December.
US CPI Preview: Forecasts from 10 major banks
US headline CPI inflation is expected to tick slightly higher MoM in December, forecast to rise from 0.1% to 0.2%, while annualized inflation for the year ended December is seen rising from 3.1% to 3.2%.
Core US CPI inflation (headline inflation less volatile food and energy prices) is expected to hold steady MoM in December at 0.3%, but YoY Core CPI is forecast to tick down slightly from 4.0% to 3.8%.
With global markets keen for the Federal Reserve (Fed) to kick off the next rate cut cycle, investors will be scrambling for any signs that US inflation is continuing to recede, while an upside beat to US CPI inflation prints will see risk appetite slumping, and could drive the US Dollar (USD) even higher against the major currency bloc.
Japanese Yen price today
The table below shows the percentage change of Japanese Yen (JPY) against listed major currencies today. Japanese Yen was the weakest against the Euro.
| USD | EUR | GBP | CAD | AUD | JPY | NZD | CHF | |
| USD | -0.33% | -0.23% | -0.07% | -0.20% | 0.80% | 0.18% | -0.08% | |
| EUR | 0.33% | 0.09% | 0.26% | 0.14% | 1.13% | 0.51% | 0.24% | |
| GBP | 0.23% | -0.09% | 0.16% | 0.04% | 1.03% | 0.40% | 0.17% | |
| CAD | 0.06% | -0.26% | -0.16% | -0.12% | 0.87% | 0.24% | 0.01% | |
| AUD | 0.19% | -0.14% | -0.04% | 0.12% | 0.98% | 0.37% | 0.08% | |
| JPY | -0.81% | -1.13% | -1.06% | -0.88% | -1.01% | -0.63% | -0.89% | |
| NZD | -0.17% | -0.50% | -0.41% | -0.24% | -0.36% | 0.63% | -0.28% | |
| CHF | 0.07% | -0.23% | -0.13% | 0.03% | -0.08% | 0.90% | 0.28% |
The heat map shows percentage changes of major currencies against each other. The base currency is picked from the left column, while the quote currency is picked from the top row. For example, if you pick the Euro from the left column and move along the horizontal line to the Japanese Yen, the percentage change displayed in the box will represent EUR (base)/JPY (quote).
USD/JPY Technical Outlook
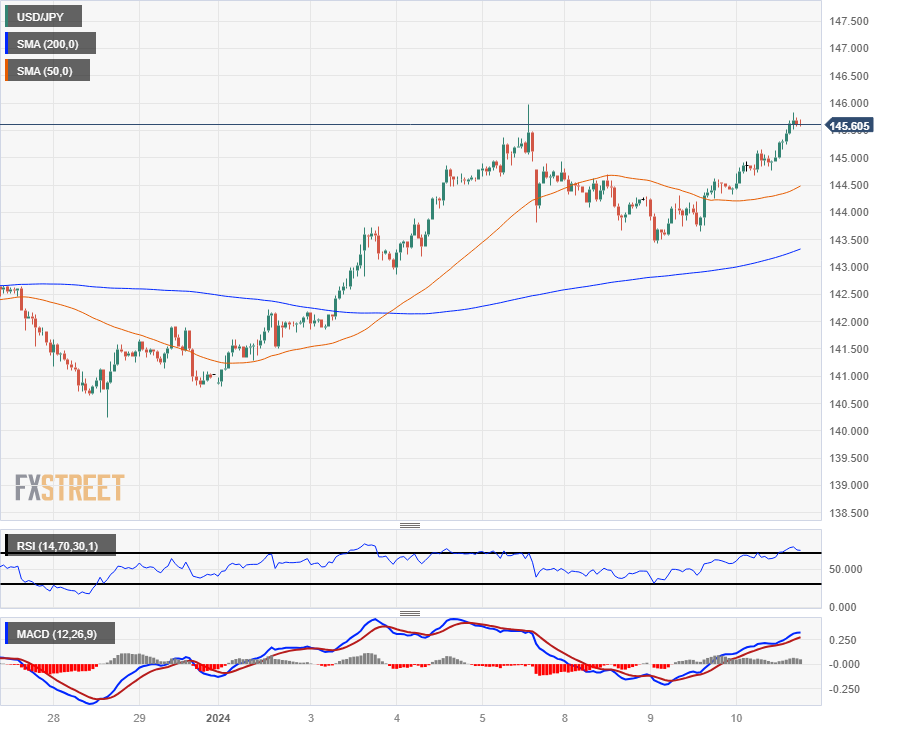
Wednesday’s broad-market Yen backslide has the USD/JPY pair surging, set to rechallenge last week’s peak bids at the 146.00 handle as near-term momentum tilts bullish with the 200-hour Simple Moving Average (SMA) rising into 143.50, a confluence level with Wednesday’s swing low.
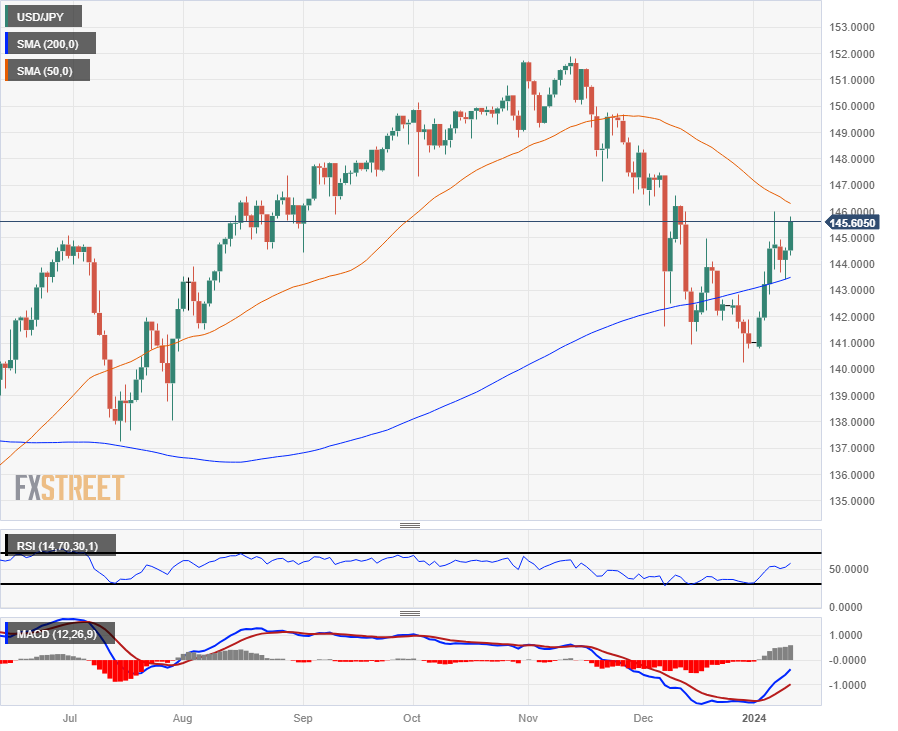
Despite a bullish lean in the USD/JPY, the pair remains constrained between the 50-day and 200-day SMAs as the two moving averages push into the middle, but 2024’s price action looks decidedly bullish after the USD/JPY’s recent bounce from the 200-day SMA near 143.00.
USD/JPY Hourly Chart
USD/JPY Daily Chart
USD/JPY Technical Levels
Artigos Recomendados


