


GBP/USD climbs as Pakistan talks boost risk mood
- GBP/USD gains as US-Iran talks in Pakistan improve market sentiment.
- US headline inflation jumped, but softer core CPI eased market concerns.
- Traders still see the Fed holding rates steady despite higher prices.
The GBP/USD climbed on Friday as risk appetite improved amid the start of US-Iran talks in Pakistan. Meanwhile, US inflation rose as expected in March, but traders seem confident it's a one-time jump as they remain optimistic about Middle East peace negotiations. The pair trades at 1.3461, up 0.20%.
Sterling firms as softer core CPI keeps peace optimism intact
Inflation in the US rose the most in almost 4 years as the Iran conflict pushed up gasoline and diesel prices. The US Consumer Price Index (CPI) increased by 3.3% YoY as expected, up from February's 2.4%. Core figures ticked up from 2.5% to 2.6% YoY, missing estimates of 2.7%, yet it failed to change investors' expectations that the Federal Reserve would not lower borrowing costs, as indicated by data from Prime Market Terminal (PMT).
Fed interest rate probabilities
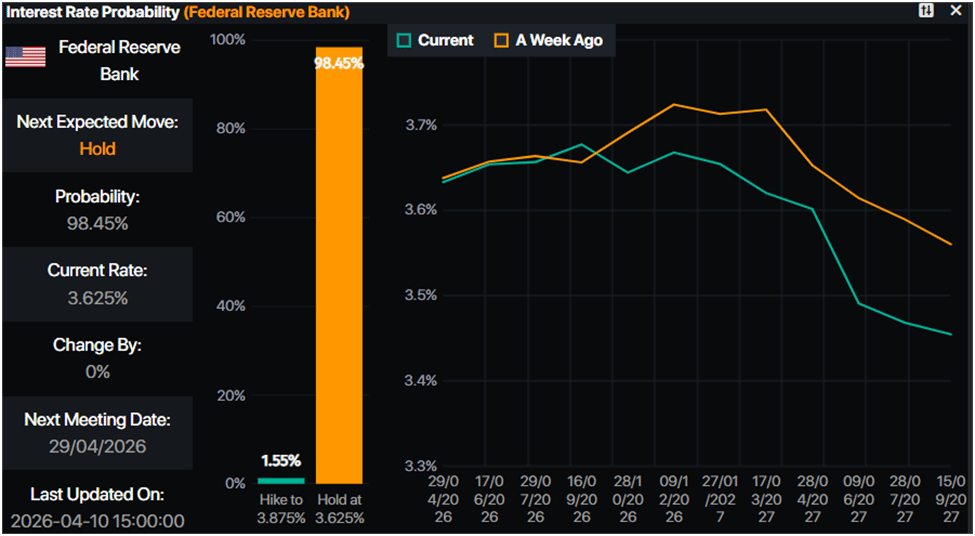
Following the data release, the GBP/USD extended its gains as the Greenback continued to decline, as reflected in the US Dollar Index (DXY). The DXY, which tracks the buck's performance against six currencies, is down 0.13% at 98.66, near four-week lows.
Other data revealed that the University of Michigan Consumer Sentiment, which plunged to a record low in April, fell to 47.6 from March's 53.3, below forecasts of 52.0. The survey revealed that the conflict changed the economic outlook as soaring energy prices pushed gasoline to $4 per gallon. Inflation expectations for one year rose from 3.8% to 4.8%, and for five years, rose from 3.2% to 3.4%.
Mary Daly from the Fed of San Francisco revealed that the high CPI print was not a surprise, though she added that the real question is whether the ceasefire would persist. Daly commented that policy is restrictive to push inflation lower yet balanced enough to support the labor market.
In the UK, expectations that the Bank of England (BoE) will raise rates in 2026 ticked higher from 32 to 42 basis points of tightening towards the end of the year, according to LSEG data.
Over the next week, traders will eye the release of Britain's Retail Sales and GDP figures, as well as speeches by BoE Governor Andrew Bailey. Across the pond, the schedule will feature housing data, the Producer Price Index (PPI), jobs data, and Fed speakers.
GBP/USD Price Forecast: Technical Outlook
In the daily chart, GBP/USD trades at 1.3458, holding a constructive bullish bias as spot remains above the clustered 50-, 100- and 200-day simple moving averages (SMAs) around 1.3435. The pair has also reclaimed the broader rising support trend context from the 1.3035 region, while still trading well beneath the longer-term descending resistance line that originates near 1.3869, suggesting the recovery is intact but not yet a full trend reversal.
On the topside, the first meaningful barrier is the descending resistance trend line coming from the 1.3869 area, which caps the broader bullish ambition while it stays intact. On the downside, immediate support is located at the nearby 1.3435 triple SMA cluster, with a deeper floor aligned with the longer-term rising support line traced from around 1.3035, where buyers would be expected to regroup if a corrective pullback develops.
(The technical analysis of this story was written with the help of an AI tool.)
Pound Sterling Price This week
The table below shows the percentage change of British Pound (GBP) against listed major currencies this week. British Pound was the strongest against the US Dollar.
| USD | EUR | GBP | JPY | CAD | AUD | NZD | CHF | |
|---|---|---|---|---|---|---|---|---|
| USD | -1.70% | -1.99% | -0.24% | -0.77% | -2.64% | -2.53% | -1.39% | |
| EUR | 1.70% | -0.29% | 1.49% | 0.97% | -0.95% | -0.84% | 0.29% | |
| GBP | 1.99% | 0.29% | 1.71% | 1.24% | -0.66% | -0.55% | 0.60% | |
| JPY | 0.24% | -1.49% | -1.71% | -0.54% | -2.40% | -2.27% | -1.18% | |
| CAD | 0.77% | -0.97% | -1.24% | 0.54% | -1.87% | -1.74% | -0.63% | |
| AUD | 2.64% | 0.95% | 0.66% | 2.40% | 1.87% | 0.11% | 1.27% | |
| NZD | 2.53% | 0.84% | 0.55% | 2.27% | 1.74% | -0.11% | 1.16% | |
| CHF | 1.39% | -0.29% | -0.60% | 1.18% | 0.63% | -1.27% | -1.16% |
The heat map shows percentage changes of major currencies against each other. The base currency is picked from the left column, while the quote currency is picked from the top row. For example, if you pick the British Pound from the left column and move along the horizontal line to the US Dollar, the percentage change displayed in the box will represent GBP (base)/USD (quote).
Artigos Recomendados


