


CoreWeave Falls to 18-Month Low Ahead of Earnings as CRWV Breaches $45, Risks Testing $40 IPO Price
TradingKey - CoreWeave (CRWV) is scheduled to release its quarterly earnings, but investors have not been aggressively betting on a rebound ahead of the report. Although the stock climbed 6.28% to $46.40 in the previous trading session, pre-market trading saw it retreat again to $44.87, falling below the $45 mark and nearing an 18-month low. Compared to its price near $90 in early October, CoreWeave has pulled back by about 50% in just over a month, showing that market sentiment toward AI infrastructure firms is shifting from chasing growth to scrutinizing debt, cash flow, and returns on investment.
CoreWeave was once a prime beneficiary of the surging demand for AI computing power. The company rapidly expanded its cloud computing business by purchasing Nvidia GPUs at scale, leasing data centers, and signing long-term contracts with major tech firms. However, this growth model requires massive upfront capital expenditures before revenue materializes, with equipment procurement, power supply, data center construction, and interest expenses all exerting pressure on cash flow. When market risk appetite is high, investors are more willing to price the company based on long-term backlogs and future revenue; however, in an environment of declining tech valuations and widening credit spreads, the financing risks inherent in this capital-intensive business model are once again magnified.
The market is particularly focused on whether the company can demonstrate that its existing contracts are sufficient to cover mounting construction and financing costs. AI data center projects typically require long build-out cycles, while GPU technology iterates very rapidly; if new facilities face delays in becoming operational, the company could not only miss demand windows but also continue to shoulder depreciation and interest expenses. As credit markets grow more cautious regarding AI-related debt, CoreWeave may face higher borrowing costs and stricter financing conditions should it need to raise further capital in the future.
Source: TradingView
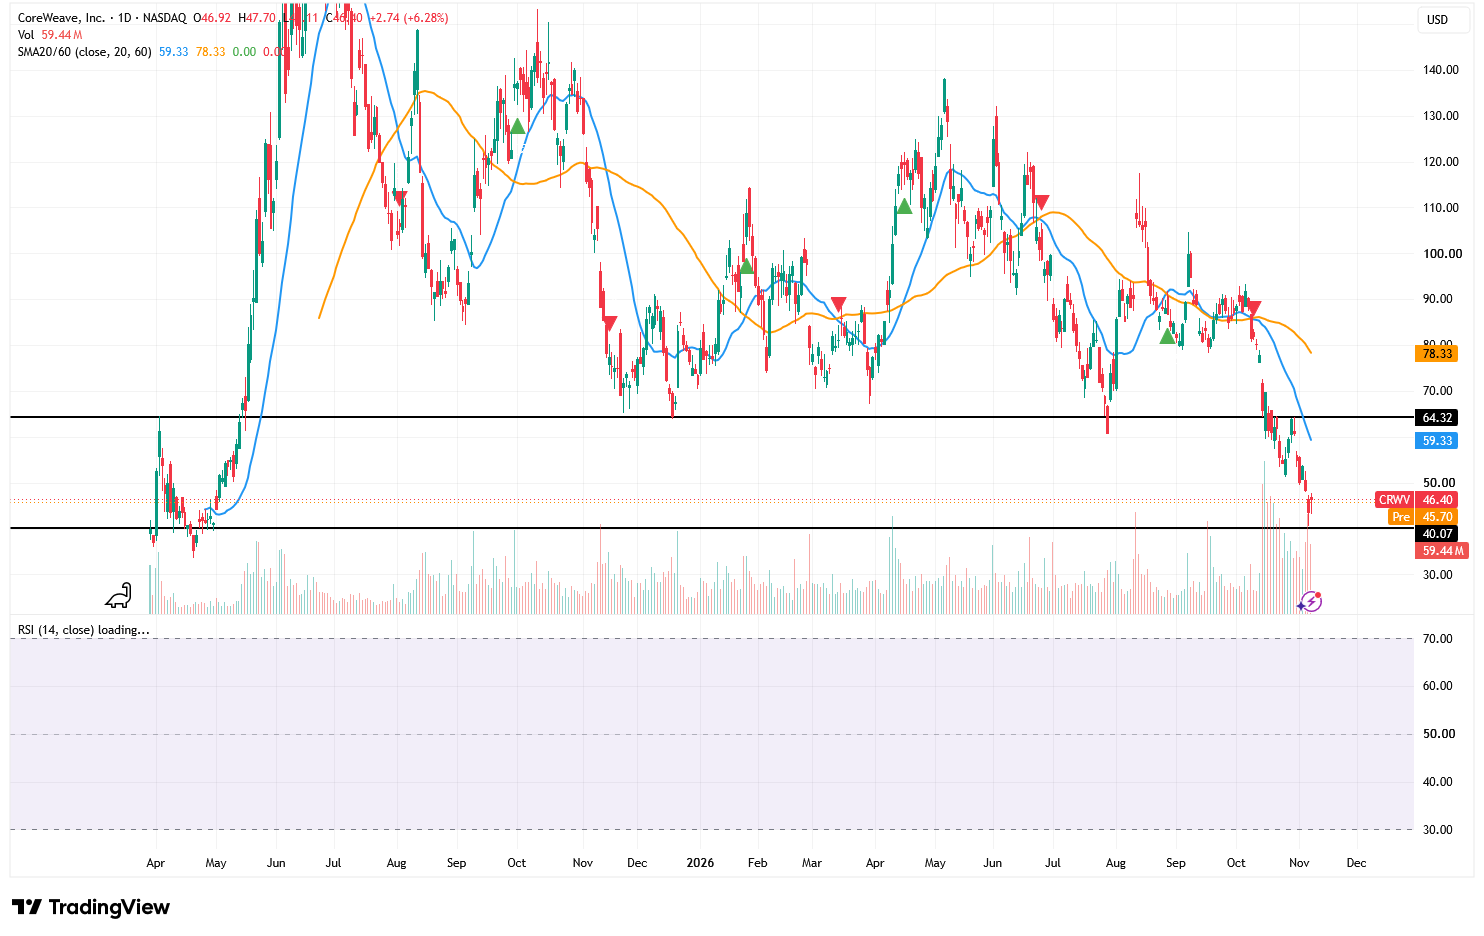
From a technical perspective, CoreWeave hit an intraday low of $43.11, marking its lowest level since late April 2025 and roughly an 18-month low. Although the stock subsequently rebounded to close at $46.40—a single-day gain of 6.28%—the cumulative maximum drawdown from its October interim peak near $90 still exceeds 52%, and the overall downtrend has yet to be reversed.
Notably, this rebound was accompanied by a significant expansion in trading volume; however, after touching $47.70, the stock pulled back and still closed below its opening price of $46.92, indicating that while buying support emerged at lower levels, overhead selling pressure has not fully dissipated. The pre-earnings rally resembles an oversold bounce rather than a confirmed new uptrend.
In the near term, the $43 to $45 range constitutes the first support zone, with $43.11 being the latest low; however, because this level has not been tested and confirmed multiple times, its support strength remains limited. The genuinely critical line of defense lies near $40, which serves not only as an important psychological threshold but also sits close to CoreWeave's IPO price and early volume-dense trading area. If earnings fall short of expectations and drive the stock to break below $40 on heavy volume, further downside could open up, potentially retesting the $35 to $37 zone in the next phase. A decline from $46.40 to $40 represents a potential drop of approximately 14%.
To the upside, attention should first focus on the resistance band between $48 and $50. Only by reclaiming and holding above $50 can the stock demonstrate that this rebound has some staying power. It would then need to break through the prior consolidation platform near $55. If earnings and management guidance exceed expectations, propelling CRWV above $55 on heavy volume, the rebound target could extend further toward $60. A rise from $46.40 to $60 represents potential upside of nearly 29%, though the $60 to $65 range is also a congested zone characterized by previous fierce tugs-of-war between buyers and sellers, where selling pressure is expected to be heavy.
Recommended Articles


