


Bitcoin and Gold Outlook: BTC eyes $70,000, XAU defends $4,000 as focus shifts to US CPI inflation
- Bitcoin hovers below $75,000 on Monday, continuing its steady decline after breaking beneath its 200-day EMA at around $76,492.
- Gold edges higher above $4,100, extending its nearly 5% rebound from last week.
- Stronger-than-expected US jobs report and rising odds of Fed rate hikes weigh on high-risk assets.
Bitcoin (BTC) trades in the red below $75,000 on Monday, while Gold (XAU/USD) attracts some buyers, holding above $4,100. Market dynamics shifted toward risk aversion after last week's US midterms, resulting in a 5% rebound in Gold as a safe-haven asset, while BTC’s high-risk nature led to a 4% loss in the same period.
Democrats’ sweeping victory in both the House of Representatives and the US Senate has raised concerns about tighter regulations to deal with the AI debt crisis and crypto. However, the focus now shifts to US inflation after the US Nonfarm Payrolls (NFP) rose by 165,000 in October, more than double the 65,000 forecast, indicating that unemployment fell to 4.1% and increasing the odds of a rate hike to bring inflation back to its 2% target. On Tuesday, traders will focus on the US Consumer Price Index (CPI) release, which is expected to show easing inflation in October compared to the previous month.
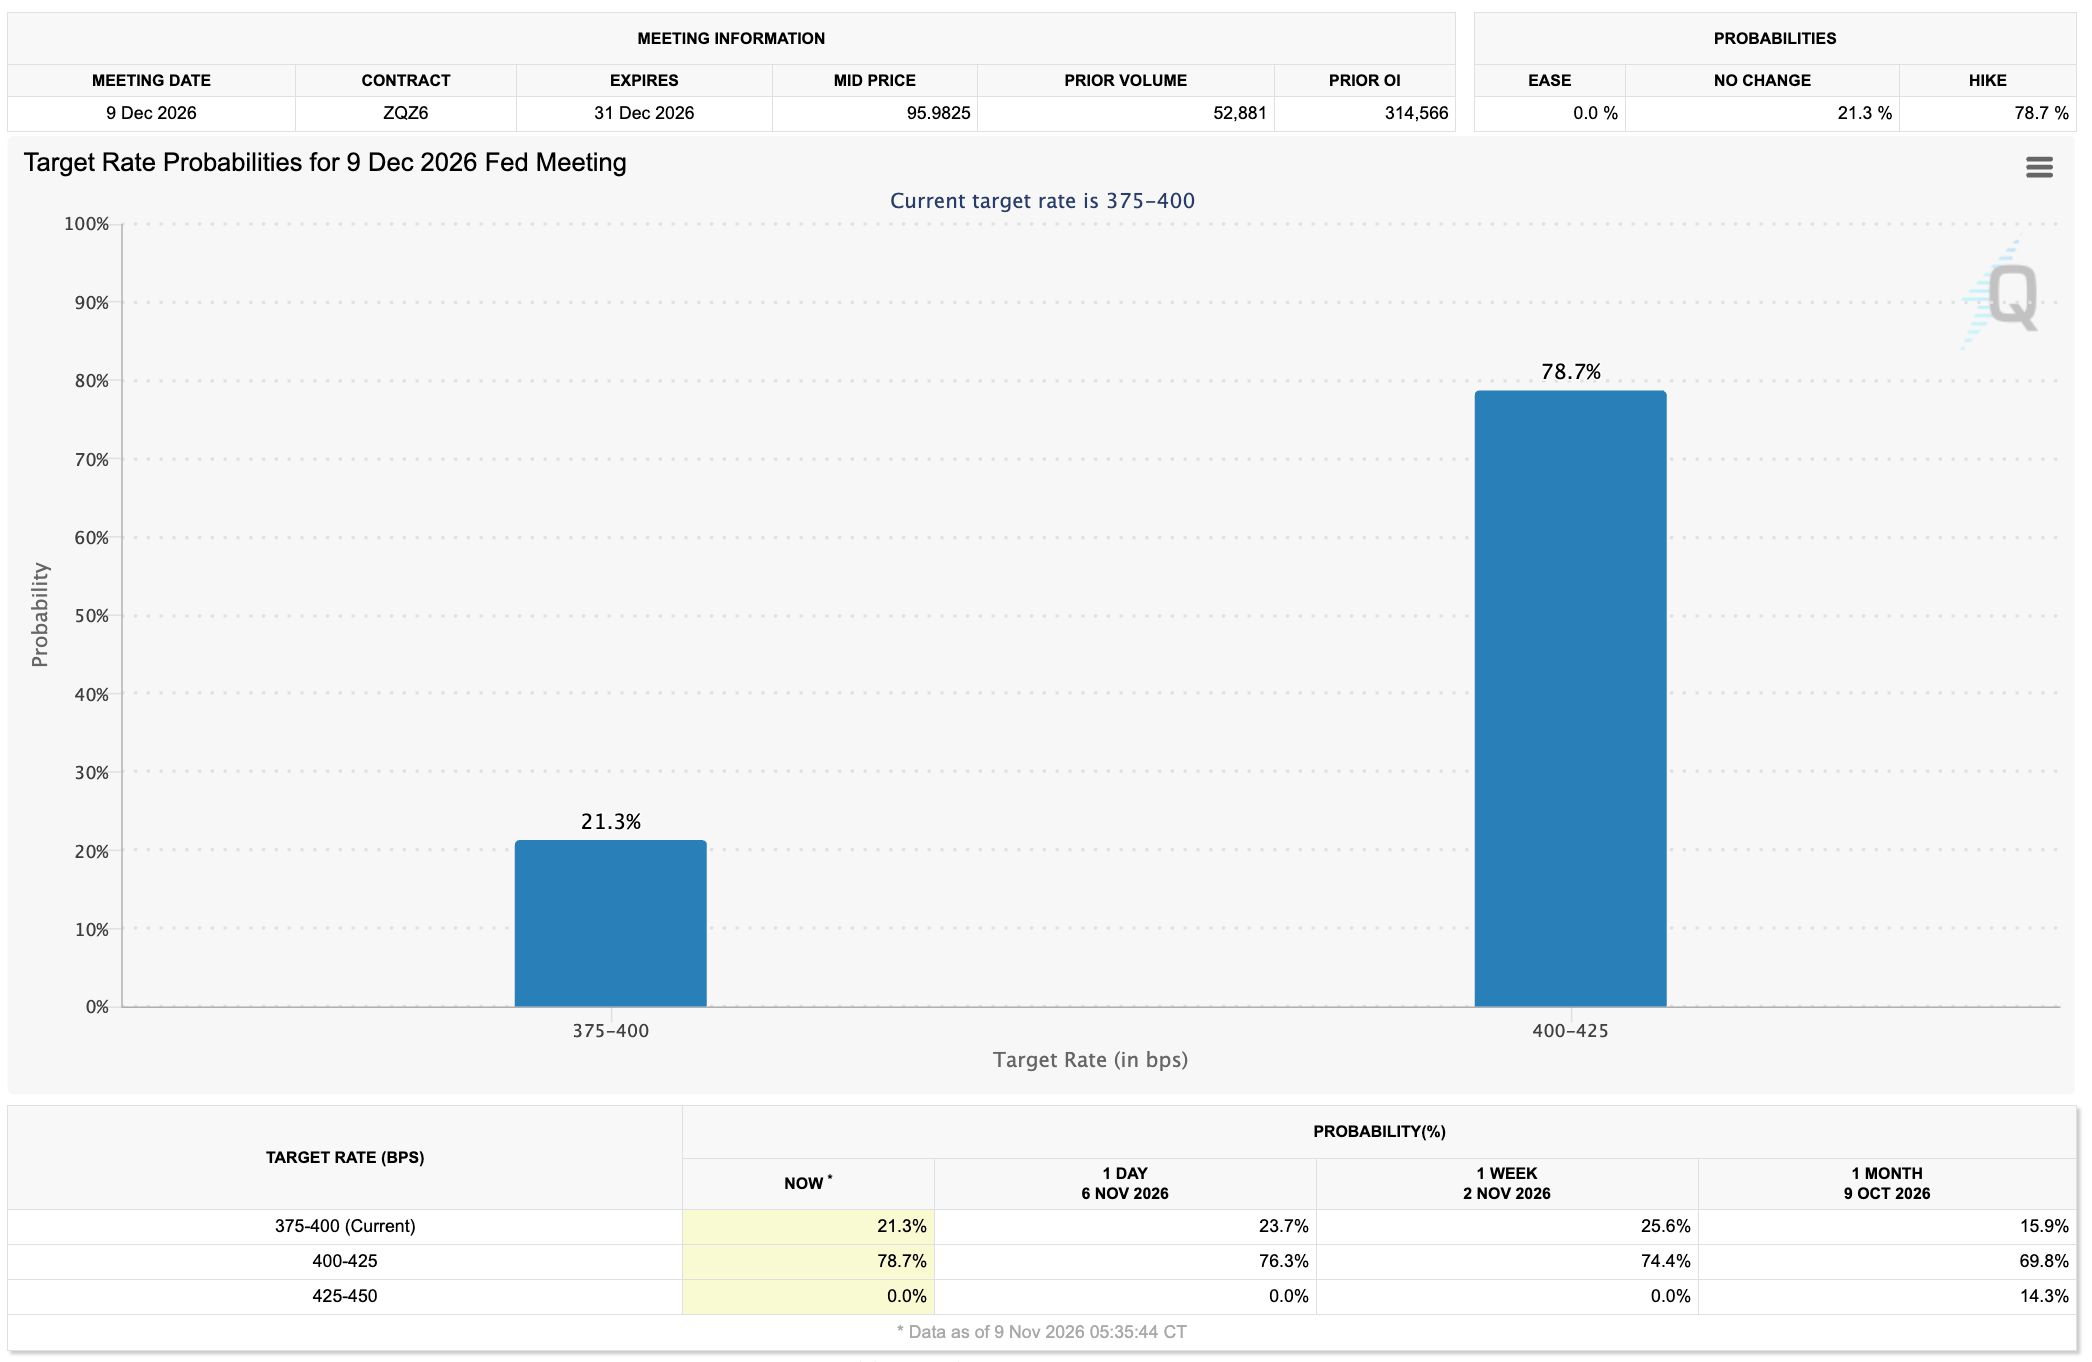
FedWatch Tool shows that the market anticipates a 78% chance that the US Federal Reserve (Fed) could raise interest rates by 25 basis points, moving them into the 4.00%-4.25% range.
However, West Texas Intermediate (WTI) Oil prices eased to $87, down 12% last week, amid hopes that the Democrats, who dominate Congress, would pressure US President Donald Trump to end the war with Iran. Cheaper energy could ease global inflation concerns and delay the need for a rate hike.
Technical outlook: Bitcoin below $75,000 eyes further downside
Bitcoin trades at $74,508 on Monday, holding a bearish bias with five straight weeks of losses totaling a 13% decline. The Crypto King retreats below both the 50-day and 200-day Exponential Moving Averages (EMAs) at $79,286 and $76,492, respectively, after failing to sustain the recent highs.
Momentum shows a downside bias on the daily chart, with the Moving Average Convergence Divergence (MACD) and signal line steadily declining into negative territory, while the Relative Strength Index (RSI) slips to 34, hinting at persistent downside pressure, with conditions edging closer to oversold but not yet extreme.
Looking down, initial support is aligned with the horizontal level at $70,505, ahead of the next cushions at $67,292 and $62,345, with deeper medium-term floors at $60,000 and $57,800, where sellers could begin to lose momentum if reached.
On the topside, immediate resistance is seen at the horizontal barrier near $75,545, followed by the 200-day EMA at $76,492 and the 50-day EMA at $79,286, before stronger supply emerges at $82,300 and the recent structural cap around $87,395.
Gold technical analysis: XAU steadily extends rebound above $4,000
XAU/USD trades at $4,107, showing a near-term recovery tone after last week's 5% rebound. Still, the yellow metal keeps a capped tone as it remains below the 50-day EMA at $4,152.
From a technical perspective, XAU forms a falling wedge pattern, with two converging trendlines on the daily chart. The descending resistance trendline near $4,335 connects the January 29 and August 25 highs, while the rising support trendline near $3,730 connects the March 23 and June 30 lows.
Momentum stabilizes after its recent slide, with the MACD rising above its signal line, while the RSI at 51 reclaims the midline, hinting at improving but still fragile upside momentum.
Initial resistance emerges at the 50-day EMA around $4,152, followed by the 200-day EMA at $4,259. A daily close above these barriers would be needed to ease the prevailing bearish bias before the downtrend resistance break level near $4,335 comes into focus.
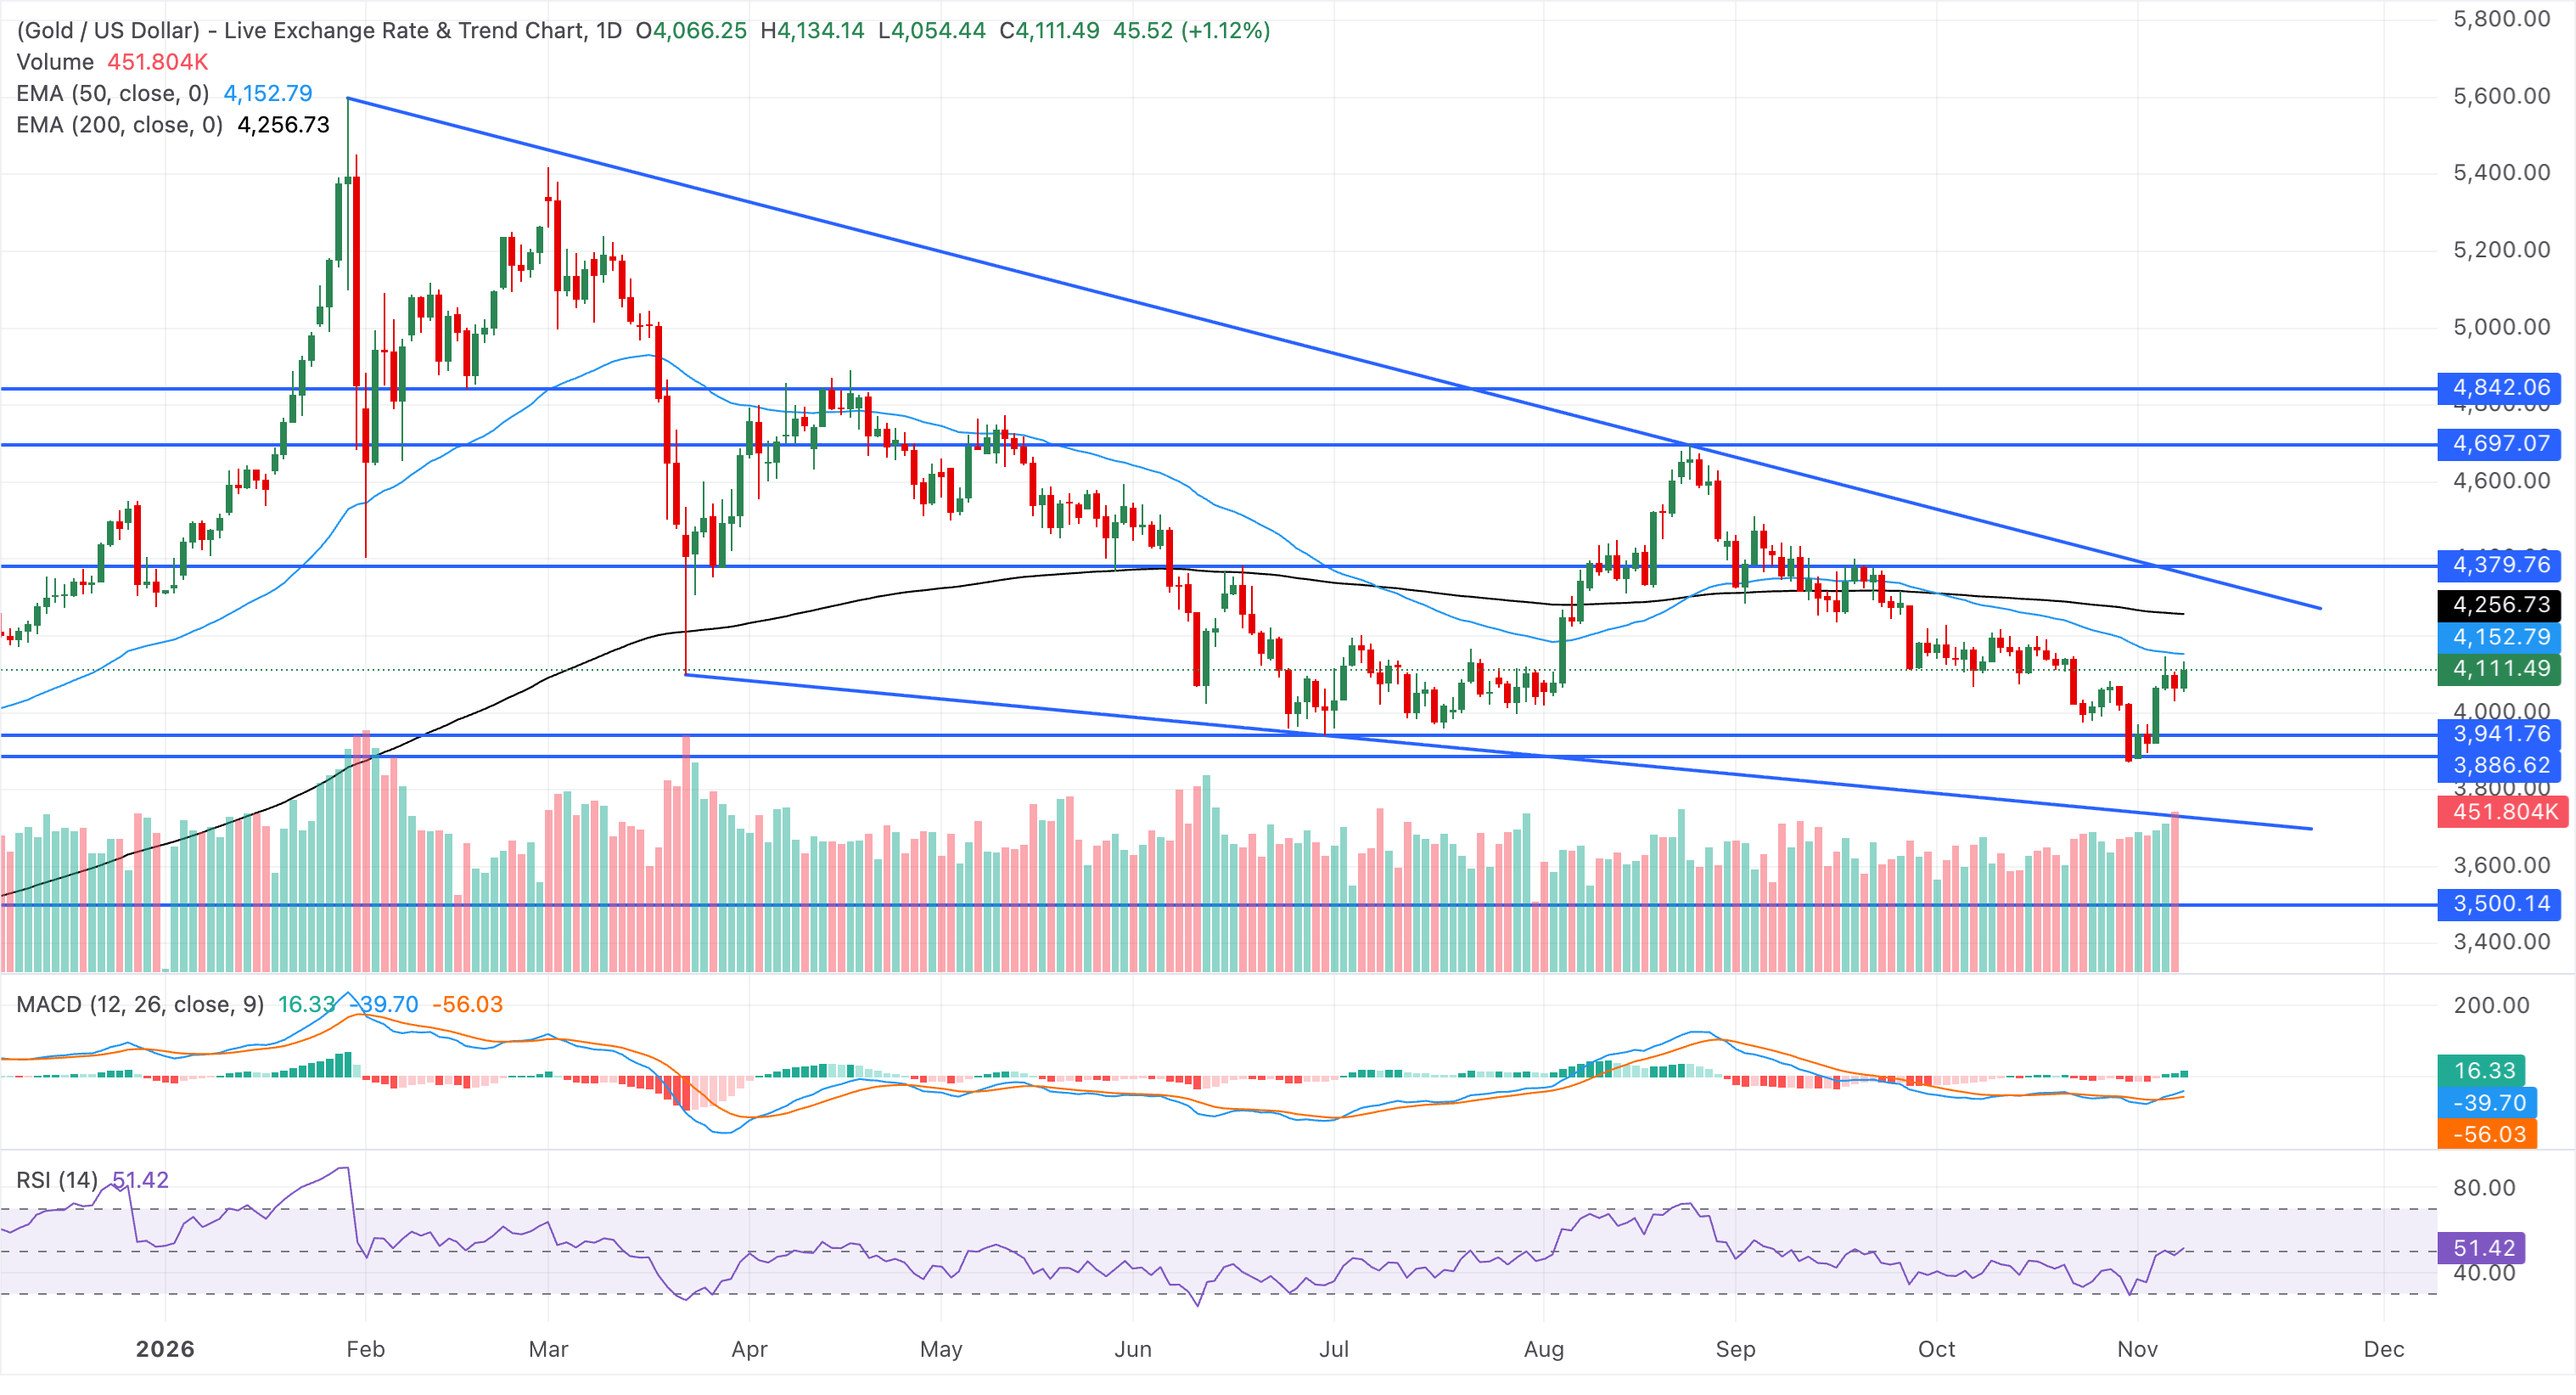
On the downside, first support is seen at $3,941, ahead of the lower horizontal floors at $3,886 and the support trendline near $3,730, where a sustained break would expose deeper retracement and reinforce the broader corrective phase in Gold.
(The technical analysis of this story was written with the help of an AI tool. Know more.)
Gold FAQs
Gold has played a key role in human’s history as it has been widely used as a store of value and medium of exchange. Currently, apart from its shine and usage for jewelry, the precious metal is widely seen as a safe-haven asset, meaning that it is considered a good investment during turbulent times. Gold is also widely seen as a hedge against inflation and against depreciating currencies as it doesn’t rely on any specific issuer or government.
Central banks are the biggest Gold holders. In their aim to support their currencies in turbulent times, central banks tend to diversify their reserves and buy Gold to improve the perceived strength of the economy and the currency. High Gold reserves can be a source of trust for a country’s solvency. Central banks added 1,136 tonnes of Gold worth around $70 billion to their reserves in 2022, according to data from the World Gold Council. This is the highest yearly purchase since records began. Central banks from emerging economies such as China, India and Turkey are quickly increasing their Gold reserves.
Gold has an inverse correlation with the US Dollar and US Treasuries, which are both major reserve and safe-haven assets. When the Dollar depreciates, Gold tends to rise, enabling investors and central banks to diversify their assets in turbulent times. Gold is also inversely correlated with risk assets. A rally in the stock market tends to weaken Gold price, while sell-offs in riskier markets tend to favor the precious metal.
The price can move due to a wide range of factors. Geopolitical instability or fears of a deep recession can quickly make Gold price escalate due to its safe-haven status. As a yield-less asset, Gold tends to rise with lower interest rates, while higher cost of money usually weighs down on the yellow metal. Still, most moves depend on how the US Dollar (USD) behaves as the asset is priced in dollars (XAU/USD). A strong Dollar tends to keep the price of Gold controlled, whereas a weaker Dollar is likely to push Gold prices up.
Recommended Articles


