


Warren Buffett Won His 10-Year Bet Against Hedge Funds. Here's What the S&P 500 Has Done Since It Ended.
Key Points
The S&P 500 index fund in Buffett's bet returned 125.8% from 2008 through 2017, topping all five funds of hedge funds chosen against it.
Since the end of 2017, a Vanguard S&P 500 fund has more than tripled an investor's money with dividends reinvested.
Set aside 2008, and the bet years compounded at around the same rate as the years since.
- 10 stocks we like better than S&P 500 Index ›
On Dec. 19, 2007, Warren Buffett bet that a low-cost index fund built to track the S&P 500 (SNPINDEX:^GSPC) would beat a hand-picked set of hedge funds over the 10 years from the start of 2008 to the end of 2017. It wasn't close. The index fund returned 125.8% in the decade, or around 8.5% a year. The five funds of hedge funds picked against it returned between 2.8% and 87.7%.
The bet ended nearly nine years ago. With dividends reinvested, the same type of fund has more than tripled since the end of 2017 -- a bigger gain in under nine years than the bet's winner made in all 10.
Missed AI’s "Act 1"? Act 2 Could Be 15x Bigger. Most investors think they missed the AI boat because they didn't buy Nvidia in 2005. But according to our analysts, we’re only at the end of "Act 1"—the R&D phase. "Act 2" is the global rollout. Continue »
But I think most of that gap boils down to the year the bet began.
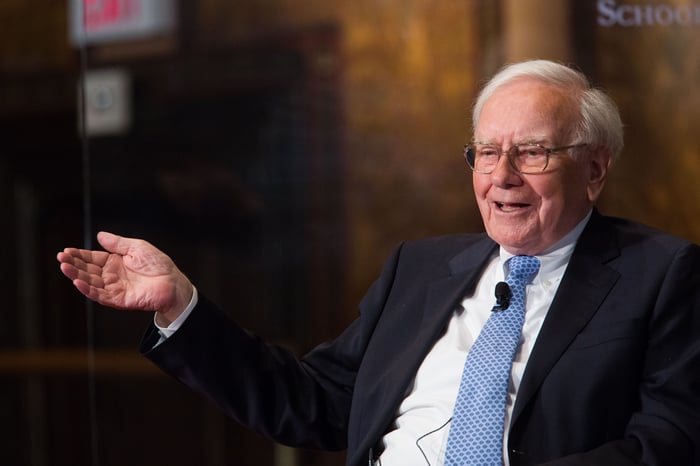
Warren Buffett. Image source: Getty Images.
A lopsided result
Buffett's rival was Protégé Partners, an asset manager whose co-manager, Ted Seides, was the only pro to take on his challenge. Protégé chose five funds of funds (funds that invest in a group of hedge funds), but Buffett picked a low-cost Vanguard S&P 500 index fund.
To be fair, the hedge funds started well. All five funds of funds beat the index fund in 2008, when the index fund fell 37%. But in each of the next nine years, the funds of funds as a group lagged it. The best of the five returned 87.7% over the decade, or around 6.5% a year, versus the index fund's 8.5%. The other four averaged 3.6% a year or less, and one, which was liquidated in 2017, returned just 2.8% over its nine years.
"Performance comes, performance goes. Fees never falter," Buffett said in his 2017 letter to Berkshire Hathaway shareholders. In the same letter, he estimated investors in the funds of funds paid fixed fees averaging around 2.5% of assets a year, plus the share of gains their managers took.
How has the S&P 500 done since?
To check, I used the Vanguard S&P 500 ETF (NYSEMKT:VOO) as a stand-in. With dividends reinvested, $10,000 put in the fund at the close on Dec. 29, 2017 (the last trading day of the bet) would be worth around $33,300 as of this writing. That's a gain of about 233%, or almost 15% a year.
The bet's winner, by comparison, turned $10,000 into around $22,600 in its 10 years.
On price alone, without the dividends, the gain is about 190%. I'm counting dividends because the bet's scorecard counted them too.
Of course, the ride wasn't smooth. The fund had two losing years, 2018 and 2022, and the second cost it around 18%. And in early 2020, it fell about 34% between Feb. 19 and March 23.
But the fund rose over 17% in six of the eight full calendar years since the bet, with its best year, 2019, up 31%. And it's up around 14% so far in 2026.
Most of the gap comes from 2008
The bet's first year was 2008, the year of the financial crisis, and it was the index fund's only losing year of the 10. Leave that year out, and the index fund's other nine years grew at an average of around 15% a year -- almost the same rate as the years since the bet ended.
In other words, the S&P 500 didn't suddenly get better after 2017. The bet's 10 years just happened to begin with a crash. Buffett himself wrote that if experts had been asked for a forecast in late 2007, their guesses would likely have averaged near the 8.5% the index returned.
Put the two stretches together, and $10,000 in the index fund at the start of 2008 would be worth around $75,000 today. That comes to about 11% a year over almost 19 years, through two crashes and two other down years.
If anything, the years since the bet back up what Buffett set out to prove. Buying a low-cost index fund and sitting through the bad years worked in both stretches, without betting on any one growth stock.
For long-term money, I'd still choose a low-cost S&P 500 index fund now over looking for the best stocks to buy. But a decade that opens the way 2008 did can pull the average down a lot, and nobody knows when the next one might come. I'd just plan on returns closer to the bet's 8.5% a year than the almost 15% since it ended.
Should you buy stock in S&P 500 Index right now?
Before you buy stock in S&P 500 Index, consider this:
The Motley Fool Stock Advisor analyst team just identified what they believe are the 10 best stocks for investors to buy now… and S&P 500 Index wasn’t one of them. The 10 stocks that made the cut could produce monster returns in the coming years.
Consider when Netflix made this list on December 17, 2004... if you invested $1,000 at the time of our recommendation, you’d have $355,124!* Or when Nvidia made this list on April 15, 2005... if you invested $1,000 at the time of our recommendation, you’d have $1,296,254!*
Now, it’s worth noting Stock Advisor’s total average return is 901% — a market-crushing outperformance compared to 210% for the S&P 500. Don't miss the latest top 10 list, available with Stock Advisor, and join an investing community built by individual investors for individual investors.
See the 10 stocks »
*Stock Advisor returns as of October 25, 2026.
Daniel Sparks and his clients have positions in Berkshire Hathaway. The Motley Fool has positions in and recommends Berkshire Hathaway and Vanguard S&P 500 ETF. The Motley Fool has a disclosure policy.
Recommended Articles


