


We Are Witnessing the Stock Market Do Something for Only the 3rd Time in 156 Years, and History Suggests This Will Come Next
Key Points
Generative AI has helped the stock market push new all-time highs despite mounting challenges in the economy.
One key metric suggests a big correction could be on the horizon.
- Motley Fool Issues Rare "Total Conviction" Buy Alert ›
Over the long haul, investing in the stock market is one of the best ways to build wealth, but it isn't a get-rich-quick scheme. And periods of unusually high returns are often followed by sharp declines as market expectations and corporate valuations come back down to Earth.
This historic pattern is particularly relevant for investors right now. During the past four years, the benchmark S&P 500 (SNPINDEX: ^GSPC) has grown by a whopping 21% annually -- more than double its 100-year average return of about 10%. Let's dig deeper into what history suggests might happen next and discuss strategies investors can use to stay ahead.
Missed AI’s "Act 1"? Act 2 Could Be 15x Bigger. Most investors think they missed the AI boat because they didn't buy Nvidia in 2005. But according to our analysts, we’re only at the end of "Act 1"—the R&D phase. "Act 2" is the global rollout. Continue »
This has only happened three times
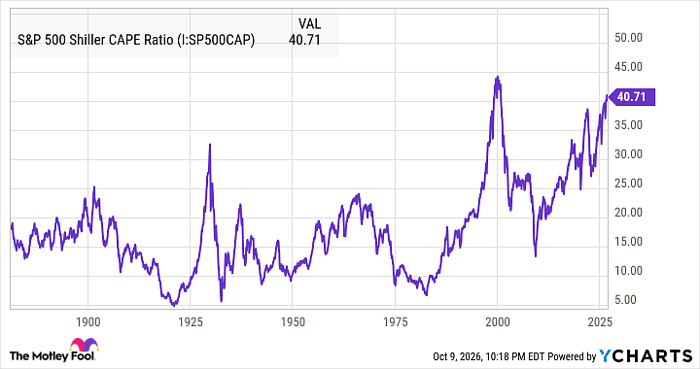
In 1988, Nobel Prize-winning economist Robert Shiller introduced the cyclically adjusted price-to-earnings (CAPE) ratio. The metric compares the value of the S&P 500 to its 10-year average inflation-adjusted earnings to highlight periods of long-term overvaluation in the market.
During the past 156 years, it has only surpassed 32 three times.
S&P 500 Shiller CAPE Ratio data by YCharts
The first peak was right before the Great Depression in 1929, when it hit 32.6. The second time was during the dot-com bubble in 1999, when it peaked at 44.2. The third time is happening right now at almost 41. And it isn't hard to see why.
Optimism surrounding generative artificial intelligence (AI) has led to rapid gains in the tech stocks expected to benefit from the trend -- much like internet companies boomed in the late 1990s. But while the CAPE ratio shows us that stocks are historically pricey, it doesn't tell us exactly when Wall Street will decide the market has become too pricey and start a big sell-off. That said, the dynamics of the AI industry itself may give even better insights into how this bull run could eventually end.
History is not repeating, but it is rhyming
Although the AI boom looks similar to the dot-com bubble on the surface, there are some key differences. Bulls will argue that the late-'90s boom was driven by speculative, unprofitable internet stocks, while the current boom is being led by stable, profitable giants.
The problem is that it is impossible to separate the fortunes of profitable AI infrastructure providers from the unprofitable consumer-facing frontier models their chips and data centers are designed to serve. Companies like OpenAI and Anthropic are already showing signs of unsustainability.
According to The Financial Times, OpenAI could burn through an eye-popping $280 billion by 2030, driven by the high costs of inputs like energy and compute. Meanwhile, sustainable monetization remains challenging due to intense competition. Low-cost AI models from China are gaining ground in technical capabilities while being dramatically cheaper to run. Reuters reports that DeepSeek's new model V4-Flash is roughly 105 times cheaper than Anthropic's Claude Fable 5 and offers performance comparable to several leading U.S.-based models.
Investors ultimately invest to make money. And it may be a matter of time before the backers of U.S. frontier models decide the opportunity offers more risk than reward. Rising bond yields and interest rates could further worsen the problem by increasing the cost of capital these companies need to fund their expansions, while also giving investors a lower-risk place to park their funds.
How do you stay ahead?

Image source: Getty Images.
The best thing about investing in stock market indexes is that you don't have to try to time the market. Index-based funds like the State Street SPDR S&P 500 ETF (NYSEMKT: SPY) offer built-in diversification. And over the long term, they typically quickly bounce back from dips.
That said, investors who aim to beat the market should probably follow the example of Warren Buffett. The Oracle of Omaha's Berkshire Hathaway is now sitting on an eye-popping $365.51 billion in cash, providing plenty of liquidity to shop for deals if stock valuations drop.
Should you buy stock in S&P 500 Index right now?
Before you buy stock in S&P 500 Index, consider this:
The Motley Fool Stock Advisor analyst team just identified what they believe are the 10 best stocks for investors to buy now… and S&P 500 Index wasn’t one of them. The 10 stocks that made the cut could produce monster returns in the coming years.
Consider when Netflix made this list on December 17, 2004... if you invested $1,000 at the time of our recommendation, you’d have $379,123!* Or when Nvidia made this list on April 15, 2005... if you invested $1,000 at the time of our recommendation, you’d have $1,408,822!*
Now, it’s worth noting Stock Advisor’s total average return is 950% — a market-crushing outperformance compared to 215% for the S&P 500. Don't miss the latest top 10 list, available with Stock Advisor, and join an investing community built by individual investors for individual investors.
See the 10 stocks »
*Stock Advisor returns as of October 12, 2026.
Will Ebiefung has no position in any of the stocks mentioned. The Motley Fool has positions in and recommends Berkshire Hathaway. The Motley Fool has a disclosure policy.
Recommended Articles


