


This Is the 1 Reason I'm Still Buying VTI Even With the Market Near All-Time Highs
Key Points
All-time highs in the stock market don't always precede a crash. They can be the start of longer bull runs.
The Vanguard Morningstar Total Stock Market ETF has delivered annualized returns of 14.7% over the past 10 years.
- 10 stocks we like better than Vanguard Morningstar Total Stock Market ETF ›
What goes up must come down, right? After the stock market has been on a long stretch of big growth, surely it's bound to go through a downturn. Nothing lasts forever. Prices revert to the mean.
Many investors are worried that the long bull market is coming to an end. Interest rates are rising. The Shiller CAPE (Cyclically Adjusted Price-to-Earnings) ratio is looking historically ominous. The S&P 500 index (SNPINDEX: ^GSPC) has recently set more all-time highs and has been staying close to those high levels.
Missed AI’s "Act 1"? Act 2 Could Be 15x Bigger. Most investors think they missed the AI boat because they didn't buy Nvidia in 2005. But according to our analysts, we’re only at the end of "Act 1"—the R&D phase. "Act 2" is the global rollout. Continue »
For most of the past year, the Vanguard S&P 500 ETF (NYSEMKT: VOO) has been hovering within 4% of its most recent all-time high.
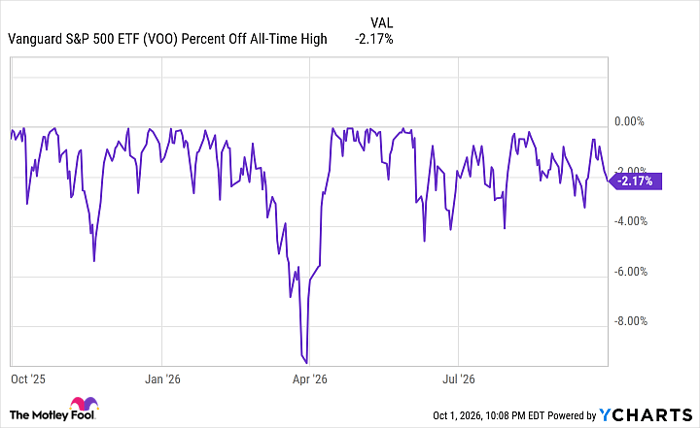
VOO Percent Off All-Time High data by YCharts.
So is the stock market overpriced? Is now a bad time to buy stocks? Are all-time highs in the stock market actually a bad sign for long-term investors? Are the biggest gains already priced in? Will we never see such big returns again?
I don't know the answer to any of those questions. What I do know is this: I'm going to keep buying the Vanguard Morningstar Total Stock Market ETF (NYSEMKT: VTI) no matter what happens with the daily ups and downs of the stock market. No matter what's in the news. As long as I have some extra money to spare from my paychecks, I'm buying stocks -- and for me, that means buying the VTI.
Here's why this total stock market ETF is going to remain the foundation of my investment portfolio, whether the stock market goes higher, crashes, or oscillates somewhere in between.

Image source: Getty Images.
Is there a "bad time" to buy stocks? Mostly...no
This sounds simple, but history shows it to be true: There's almost never a "bad time" to invest in the stock market (such as by putting money into an S&P 500 ETF). Even if you bought the S&P 500 at all-time highs, even if you bought when prices were high or valuations looked too rich, as long as you held on for the long term, historically, you likely did well.
Buying a diversified portfolio of stocks via low-cost index funds has almost always proved to be a good move for long-term investors.
Yes, the stock market might crash. There could be bad news in the economy or in the world that drives share prices down. But there can also be good news, and the effects of that can last even longer. That's why in the long run, the U.S. stock market as a whole (as represented by the S&P 500) tends to go up. Companies tend to get better at making money and paying dividends to shareholders. The economy tends to keep growing and recovering from conflicts and crises. People want to spend money. Companies want to solve problems while making a profit. Stock market growth ensues.
All-time highs in the stock market are nothing to fear. Sometimes those highs are signs of even more gains to come. When lots of people want to buy stocks, stock prices go up. This can create self-sustaining momentum. Lots of money flowing into the stock market can also be a sign of long-lasting economic growth and expanding prosperity. Stock prices reflect and feed off that optimism. The future of the stock market might be better than you think.
Why I buy VTI: It's even more diversified than the S&P 500
I keep buying VTI every month because it's so well diversified. This fund holds 3,507 stocks of all sizes -- not just the large caps and megacaps that you'll find in the S&P 500, but also the mid caps and small caps that comprise the rest of the market. The Vanguard Morningstar Total Stock Market ETF has delivered average annual returns of 14.7% over the past 10 years and about 12.6% over the past five.
This fund's performance tracks pretty closely with the S&P 500, because those large companies make up such a big percentage of the overall U.S. stock market. But I believe VTI is an even better choice for me. I want to own the long-term future of the U.S. economy, and that includes all the smaller companies that might become household names in 10 years.
Should you buy stock in Vanguard Morningstar Total Stock Market ETF right now?
Before you buy stock in Vanguard Morningstar Total Stock Market ETF, consider this:
The Motley Fool Stock Advisor analyst team just identified what they believe are the 10 best stocks for investors to buy now… and Vanguard Morningstar Total Stock Market ETF wasn’t one of them. The 10 stocks that made the cut could produce monster returns in the coming years.
Consider when Netflix made this list on December 17, 2004... if you invested $1,000 at the time of our recommendation, you’d have $361,650!* Or when Nvidia made this list on April 15, 2005... if you invested $1,000 at the time of our recommendation, you’d have $1,437,517!*
Now, it’s worth noting Stock Advisor’s total average return is 936% — a market-crushing outperformance compared to 213% for the S&P 500. Don't miss the latest top 10 list, available with Stock Advisor, and join an investing community built by individual investors for individual investors.
See the 10 stocks »
*Stock Advisor returns as of October 4, 2026.
Ben Gran has positions in Vanguard Morningstar Total Stock Market ETF. The Motley Fool has positions in and recommends Vanguard S&P 500 ETF. The Motley Fool has a disclosure policy.
Recommended Articles


