


The Stock Market Is Repeating a Pattern Seen Only Once in the Past 100 Years. Here's What History Says Comes Next.
Key Points
Stocks are soaring, but that also means we could be entering bubble territory.
Valuations are reaching levels last seen ahead of the dot-com bubble burst.
History proves that with the right strategy, right now could be a lucrative time to invest.
- 10 stocks we like better than S&P 500 Index ›
The stock market has been on a seemingly unstoppable run lately, with the S&P 500 (SNPINDEX: ^GSPC), Dow Jones Industrial Average (DJINDICES: ^DJI), and Nasdaq Composite (NASDAQINDEX: ^IXIC) all reaching multiple record highs in 2026 despite a slew of obstacles.
However, all of this growth has become a double-edged sword for investors: Climbing stock prices are lucrative in the short term, but they also increase the risk that the market is overvalued and due for a correction.
Missed AI’s "Act 1"? Act 2 Could Be 15x Bigger. Most investors think they missed the AI boat because they didn't buy Nvidia in 2005. But according to our analysts, we’re only at the end of "Act 1"—the R&D phase. "Act 2" is the global rollout. Continue »
One popular stock market metric suggests the market is repeating a pattern that has only occurred ahead of the dot-com bubble. However, history has promising news about what's coming next.

Image source: Getty Images.
Is a stock market crash coming in 2026?
It's impossible to say how the market will fare in the short term, but one widely used metric for gauging valuations is the S&P 500 Shiller Cyclically Adjusted Price-to-Earnings (CAPE) Ratio.
This metric tracks the S&P 500's 10-year inflation-adjusted earnings, and historically, it's shown an inverse correlation with future market performance. In other words, stock prices are typically lower in the years following higher readings.
While this ratio has experienced several spikes dating back to 1871, there have only been two times in history when it has consistently remained above 40: the dot-com bubble and right now.
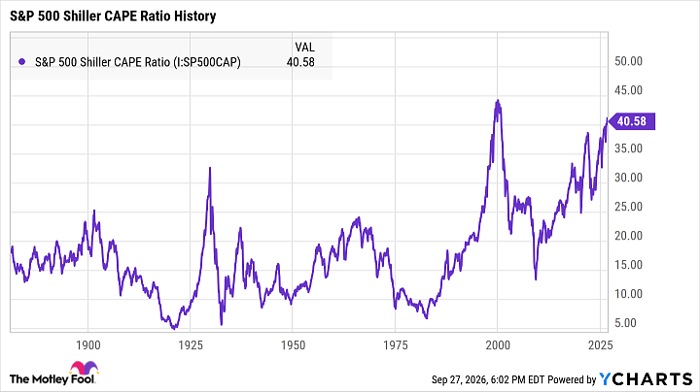
S&P 500 Shiller CAPE Ratio data by YCharts
To be clear, this doesn't mean a crash is imminent. When this ratio first sounded the alarm during the dot-com bubble, for example, it took over a year for the bear market to begin.
Back then, this metric surpassed 40 in January 1999. It stayed above 40 throughout that year, peaking at around 44 in December. Around three months later, in March 2000, the S&P 500 bear market officially began.
More recently, this ratio has consistently remained above 40 since May 2026.
What history says is coming next
The not-so-good news is that even the most reliable recession indicators can't say when a downturn will begin. The promising news, though, is that history proves time and again that investors who stay the course stand to earn the most.
For those investing during the dot-com bubble, for instance, it may have been tempting to exit the market in early 1999, when valuations began to reach dangerous territory. But between January 1999 and March 2000, when the bubble finally popped, the S&P 500 climbed by more than 26%.
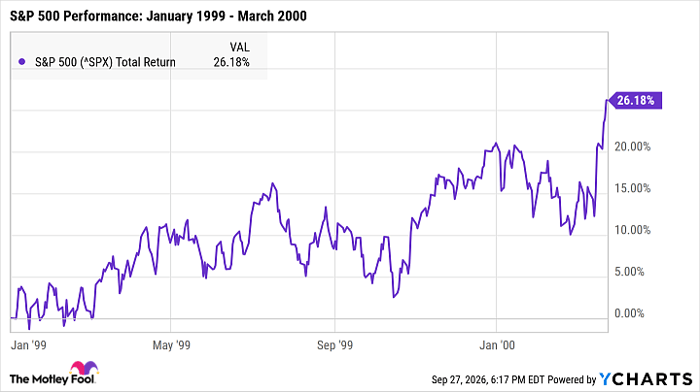
^SPX data by YCharts
Although the CAPE ratio is once again nearing dot-com-era levels, the market could still have many more months, or even years, of growth ahead. If you stop investing now, you could miss out on potentially lucrative returns.
The best news for investors, though, is that the market has always managed to thrive over the long haul. If you'd invested in the S&P 500 in January 1999, for example, you'd have earned total returns of nearly 1,000% by today.
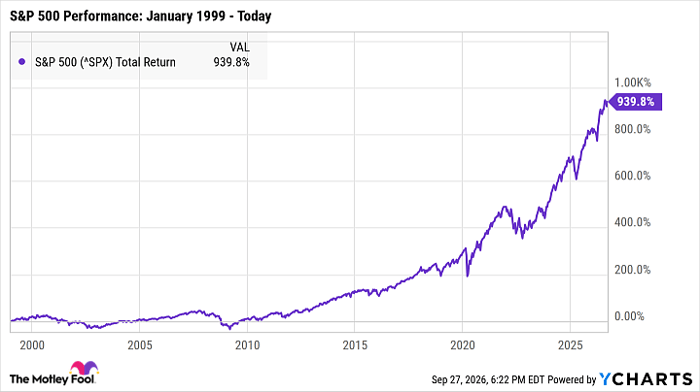
^SPX data by YCharts
History can't predict when the next bear market will begin, how long it will last, or how severe it will be. But so far, 100% of recessions, bear markets, and crashes have been followed by positive long-term returns.
The single best move investors can make right now, then, is to load up on healthy stocks and prepare to hold them for at least a few years. Not all stocks will survive a recession -- as evidenced by the dot-com bubble, when countless tech companies went bankrupt in the early 2000s. But stocks with strong foundations are the most likely to thrive over time.
Should you buy stock in S&P 500 Index right now?
Before you buy stock in S&P 500 Index, consider this:
The Motley Fool Stock Advisor analyst team just identified what they believe are the 10 best stocks for investors to buy now… and S&P 500 Index wasn’t one of them. The 10 stocks that made the cut could produce monster returns in the coming years.
Consider when Netflix made this list on December 17, 2004... if you invested $1,000 at the time of our recommendation, you’d have $383,680!* Or when Nvidia made this list on April 15, 2005... if you invested $1,000 at the time of our recommendation, you’d have $1,382,954!*
Now, it’s worth noting Stock Advisor’s total average return is 937% — a market-crushing outperformance compared to 214% for the S&P 500. Don't miss the latest top 10 list, available with Stock Advisor, and join an investing community built by individual investors for individual investors.
See the 10 stocks »
*Stock Advisor returns as of September 29, 2026.
Katie Brockman has no position in any of the stocks mentioned. The Motley Fool has no position in any of the stocks mentioned. The Motley Fool has a disclosure policy.
Recommended Articles


