


Advanced Micro Devices vs. Texas Instruments: Which Tech Stock Is a Better Buy in 2026?
Key Points
Advanced Micro Devices continues to expand its footprint in the data center market through strategic partnerships with major artificial intelligence developers.
Texas Instruments maintains a highly diversified customer base and strong profitability within the analog and embedded processing markets.
Which semiconductor stock deserves a spot in your portfolio?
- 10 stocks we like better than Advanced Micro Devices ›
As the artificial intelligence boom matures, choosing between high-growth processors and steady analog chips requires a careful look at Advanced Micro Devices (NASDAQ:AMD) and Texas Instruments (NASDAQ:TXN) as potential long-term investments.
Advanced Micro Devices focuses on high-performance computing for data centers and gaming, while Texas Instruments dominates the analog world with chips for industrial and automotive uses. While both operate in the same broad category, their business models and growth profiles offer very different opportunities for retail investors today.
The case for Advanced Micro Devices
Advanced Micro Devices designs processors and graphics chips for everything from laptops to massive data centers. Key partnerships include a strategic agreement with OpenAI to deploy advanced graphics units, alongside long-term deals with Sony (NYSE:SONY) and Microsoft (NASDAQ:MSFT) for gaming hardware. Customer concentration like this adds a layer of risk to the business since a few large buyers drive much of the volume.
In fiscal 2025, revenue reached nearly $34.6 billion, an increase of 34% over the prior year. Net income was roughly $4.3 billion, and AMD reported a net margin of approximately 12.5% for the year. This upward trend highlights the strong demand for the company's newest products among semiconductor stocks.
As of its December 2025 balance sheet, the debt-to-equity ratio is approximately 0.1, indicating that AMD relies very little on borrowed money. The current ratio, which measures a company's ability to pay short-term debts with current assets, is roughly 2.9. Free cash flow reached nearly $6.7 billion, though note that stock-based compensation represented roughly 21.2% of operating cash flow, which inflates reported cash generation since SBC is a non-cash expense added back in the cash flow statement.
The case for Texas Instruments
Texas Instruments offers a massive catalog of more than 80,000 products, focusing on analog and embedded processing. The company serves over 100,000 customers globally, primarily in the industrial and automotive markets. Because the customer base is highly diverse, with roughly half of total revenue generated by customers outside of its largest 50, the company does not rely heavily on any single buyer.
In fiscal 2025, revenue reached nearly $17.7 billion, up 13% compared to the previous year. Net income was $5 billion, resulting in a net margin of roughly 28%. In its latest annual report, filed for the fiscal year ended Dec. 31, 2025, Texas Instruments highlighted its focus on making electronics more affordable through its manufacturing scale.
Based on the December 2025 balance sheet, the debt-to-equity ratio is close to 0.9. The current ratio is approximately 4.4, suggesting the company maintains a strong cushion for its immediate financial obligations. Free cash flow for the year was nearly $2.6 billion, providing capital to support its long-term manufacturing expansion and return value to shareholders.
Risk profile comparison
Advanced Micro Devices faces intense competition from Intel (NASDAQ:INTC) and Nvidia (NASDAQ:NVDA), especially following strategic partnerships between those rivals. Geopolitical risks are also present, as U.S. export controls on advanced chips to China have caused inventory charges. Additionally, the company relies heavily on TSMC (NYSE:TSM) for manufacturing and must navigate the integration of recent acquisitions like ZT Systems.
Texas Instruments must manage the cyclical nature of the chip industry, which often sees volatile demand. Because the company owns its manufacturing plants, it faces high fixed costs that are difficult to reduce during market downturns. Significant revenue comes from customers in China, making it vulnerable to trade barriers. TI is also currently in the middle of acquiring Silicon Laboratories (NASDAQ:SLAB).
Valuation comparison
Advanced Micro Devices trades at a significantly higher premium than Texas Instruments when comparing the forward P/E and P/S ratio metrics.
| Metric | Advanced Micro Devices | Texas Instruments |
|---|---|---|
| Forward P/E | 62.0 | 31.1 |
| P/S ratio | 22.3 | 13.7 |
Valuation metrics sourced from Financial Modeling Prep (FMP) and may differ from other data providers.
Which stock would I buy in 2026?
Presumably, investors are paying a premium for AMD because of its strong revenue growth (Texas Instruments' growth didn't come close to AMD's last fiscal year). That said, I am more interested in each company's net margin. Using fiscal 2025 figures, TI's margin pretty handily tops AMD's full-year results. And while both companies have seen profits expand by a few percentage points over the trailing 12 months, that profitability gap has continued into this fiscal year.
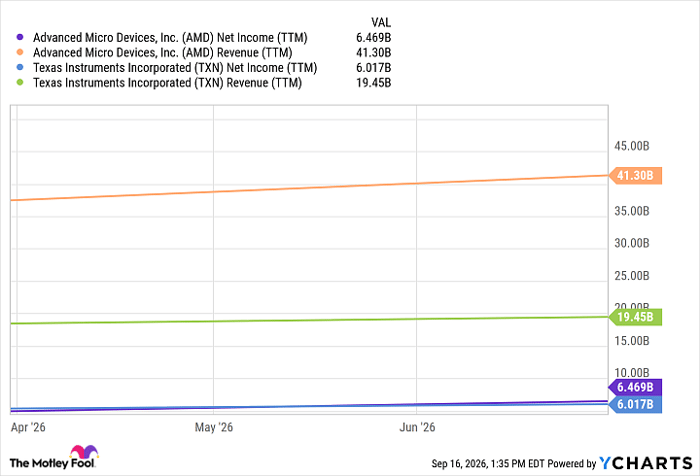
AMD Net Income (TTM) data by YCharts
As far as their actual business models, I do think AMD's fabless approach is more attractive, because it gives the company more flexibility. Texas Instruments, conversely, has to deal with the high fixed costs of owning and running its manufacturing plants.
AMD stock has absolutely exploded over the past 10 years, while Texas Instruments shares have modestly outperformed the S&P 500 over that same time frame. Past performance is no indication of future results, but it's worth taking into consideration.
All told, I like Texas Instruments better here because it appeals to the conservative side of me: It’s not crazy expensive, it has stronger profitability, and it pays a dividend yielding just over 2.1%.
Should you buy stock in Advanced Micro Devices right now?
Before you buy stock in Advanced Micro Devices, consider this:
The Motley Fool Stock Advisor analyst team just identified what they believe are the 10 best stocks for investors to buy now… and Advanced Micro Devices wasn’t one of them. The 10 stocks that made the cut could produce monster returns in the coming years.
Consider when Netflix made this list on December 17, 2004... if you invested $1,000 at the time of our recommendation, you’d have $420,109!* Or when Nvidia made this list on April 15, 2005... if you invested $1,000 at the time of our recommendation, you’d have $1,303,689!*
Now, it’s worth noting Stock Advisor’s total average return is 938% — a market-crushing outperformance compared to 211% for the S&P 500. Don't miss the latest top 10 list, available with Stock Advisor, and join an investing community built by individual investors for individual investors.
See the 10 stocks »
*Stock Advisor returns as of September 17, 2026.
Erin Kennedy has positions in Taiwan Semiconductor Manufacturing. The Motley Fool has positions in and recommends Advanced Micro Devices, Intel, Microsoft, Nvidia, Taiwan Semiconductor Manufacturing, and Texas Instruments. The Motley Fool has a disclosure policy.
Recommended Articles


