


Will the Fed Hike Again in October? Dot Plot Median Points to One More Hike This Year
TradingKey - On September 16 ET, the Federal Reserve raised the target range for the federal funds rate by 25 basis points to 3.75%-4.00%, marking its first rate hike since July 2023.
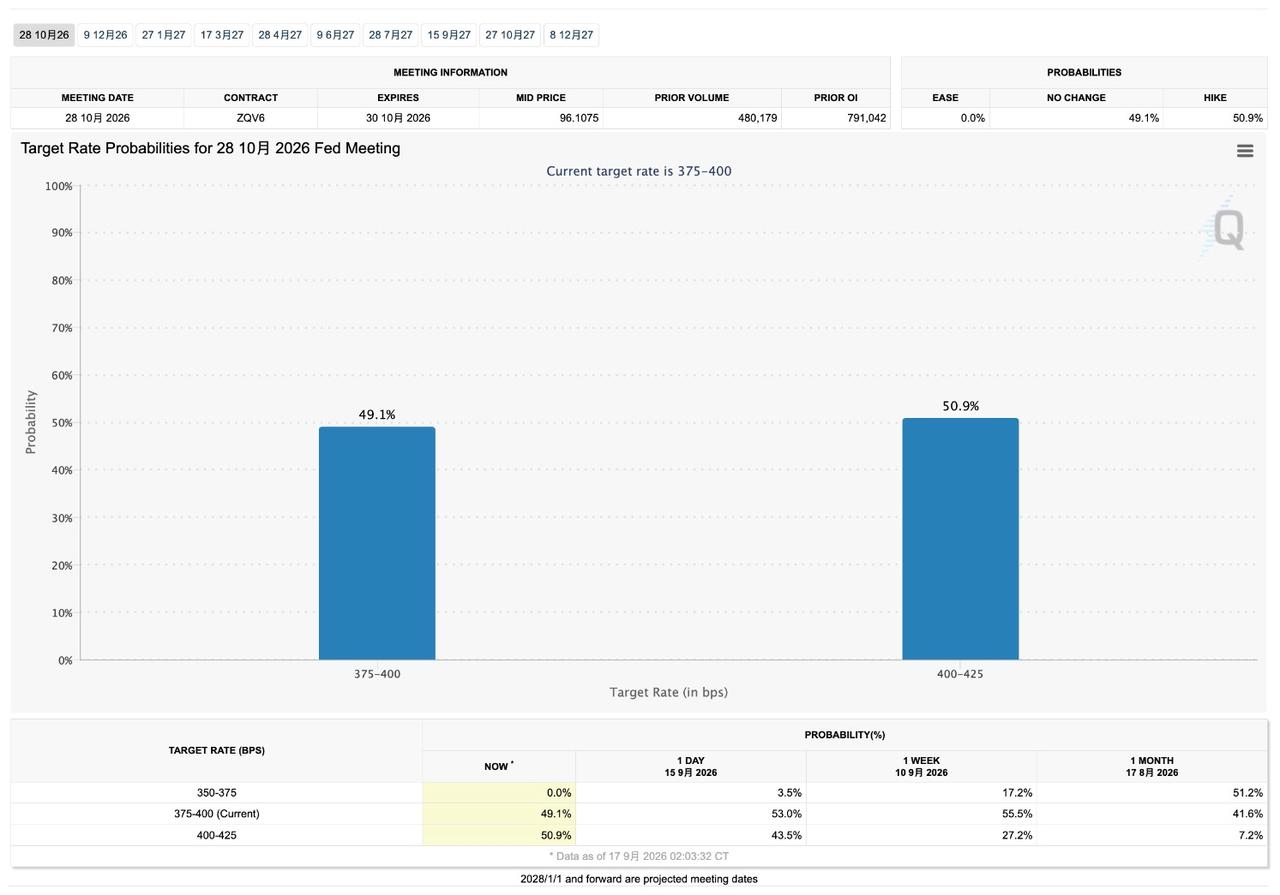
As of press time on September 17, according to CME's "FedWatch" tool, the probability of keeping interest rates unchanged in October is approximately 49.1%, while the probability of a 25-basis-point rate hike is about 50.9%, indicating that the market remains significantly divided over the October policy path.
Following the release of the Fed's September decision, the futures market estimated a roughly 13% probability of maintaining the current rate range through year-end, a nearly 52% probability of an additional 25-basis-point hike, and a more than 35% probability of a cumulative 50-basis-point increase. Based on this, the probability of at least one more rate hike before the end of the December meeting is approximately 87%.
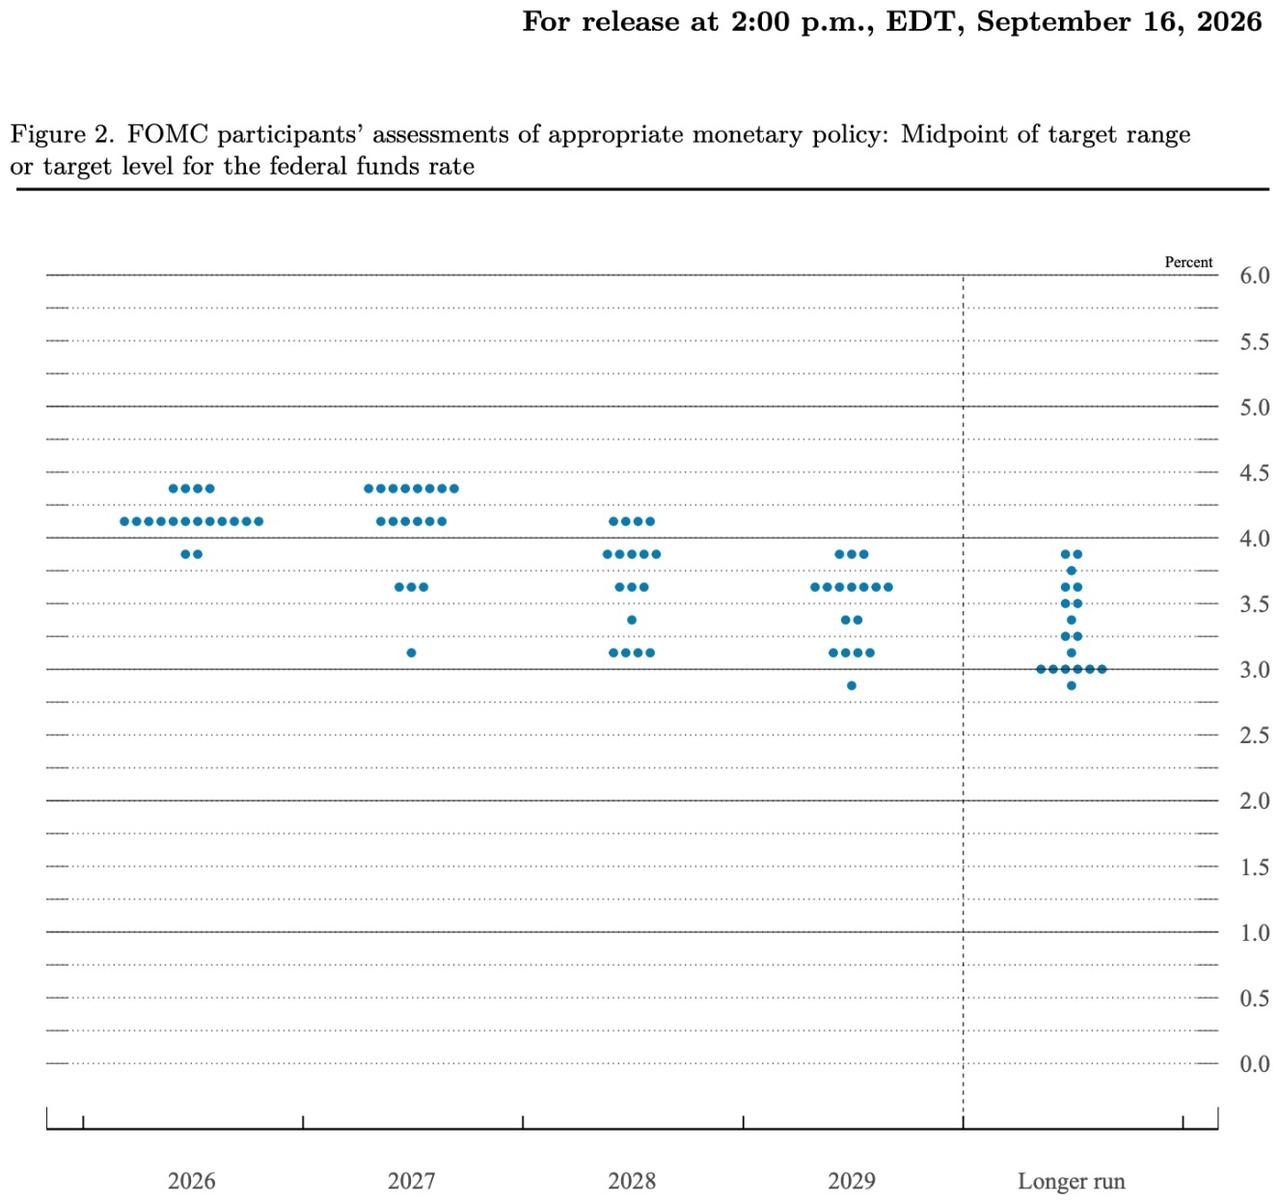
The latest dot plot shows that the median policy rate for the end of 2026 is 4.1%, corresponding to one additional 25-basis-point rate hike within the year. The futures market and the dot plot are broadly aligned on the trajectory of further rate hikes this year, but the market still assigns a more than 35% probability to two cumulative rate hikes.
[Source: CME]
Why the Dot Plot Points to Further Rate Hikes This Year
The Federal Reserve's September dot plot showed that the median federal funds rate forecast for the end of 2026 rose to 4.1% from the 3.8% projected in June, corresponding to another 25-basis-point rate hike this year.
[Source: federalreserve.gov]
Among the 18 officials submitting interest rate forecasts, 12 expected the midpoint rate at the end of 2026 to be 4.125%, corresponding to another 25-basis-point rate hike; 4 expected it to rise to 4.375%, corresponding to another 50-basis-point hike; and the remaining 2 expected it to remain at current levels. Based on this, 16 officials expect at least one more rate hike this year.
The median policy rate for 2027 was also revised upward from 3.6% to 4.1%, indicating that most officials expect interest rates to remain elevated next year.
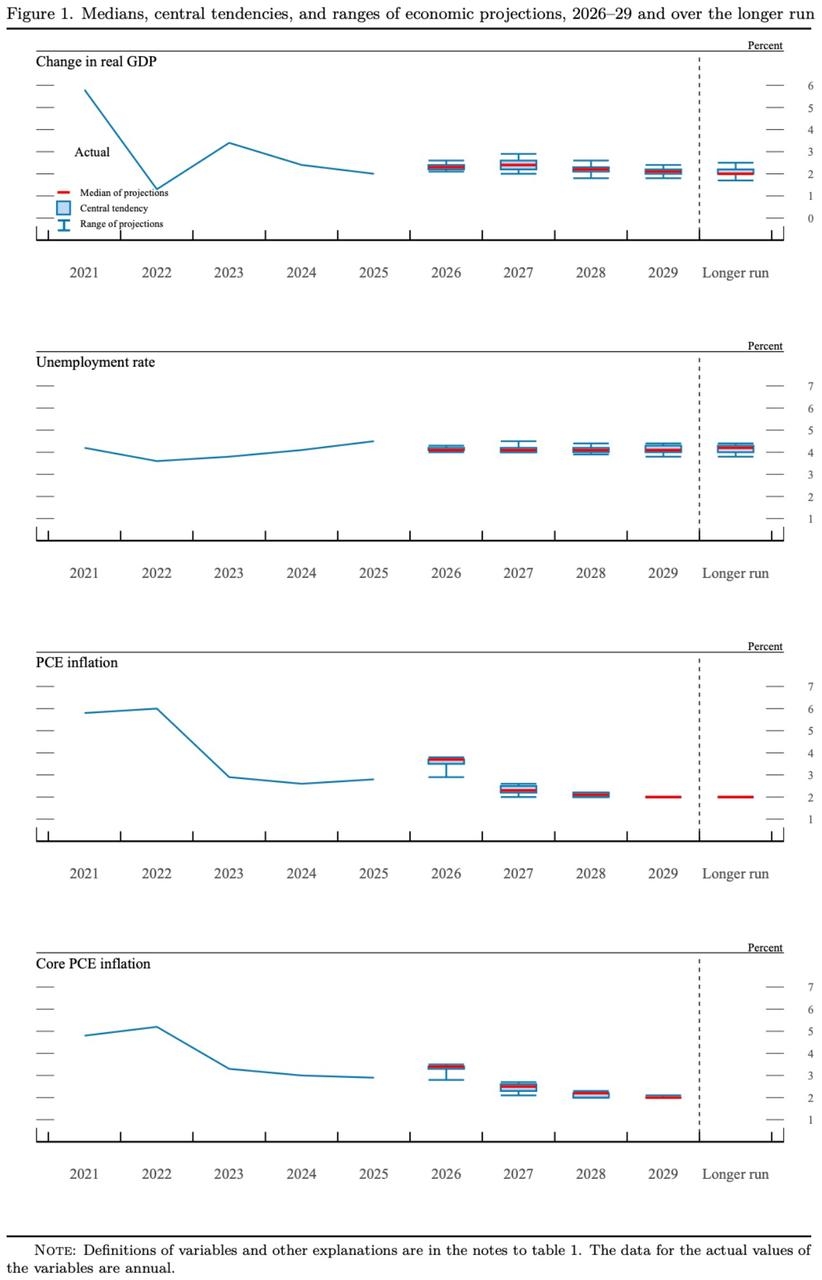
In the Summary of Economic Projections released on September 16, the Federal Reserve revised its median forecast for 2026 real GDP growth upward from 2.2% to 2.3% and lowered the fourth-quarter average unemployment rate from 4.3% to 4.1%; PCE inflation and core PCE inflation forecasts were revised upward from 3.6% and 3.3% to 3.7% and 3.4%, respectively.
Among them, both GDP and inflation figures are calculated based on changes from the fourth quarter of 2025 to the fourth quarter of 2026. Improvements in economic and employment projections provide greater room for further policy tightening, while the upward revision in inflation forecasts strengthens the case for continuing rate hikes within the year.
[Source: federalreserve.gov]
Why Markets Remain Divided Over an October Rate Hike
The dot plot reflects Fed officials' projections of the appropriate interest rate level by year-end and does not correspond to specific meetings. The Fed will announce interest rate decisions on October 28 and December 9 later this year, and the additional rate hike shown in the dot plot could be implemented at either meeting.
The market's main point of debate is whether the Fed will tighten policy in consecutive meetings following a September rate hike, or wait for more economic data before acting. Prior to the October meeting, the US will release August PCE inflation, September nonfarm payrolls, and September CPI data; oil prices, inflation expectations, and financial conditions will also factor into policy judgments. Persistent inflationary pressures and sustained labor market strength could increase the likelihood of an October hike, while cooling in key indicators could push the next move to December.
Fed Chair Kevin Warsh did not commit to the timing or number of subsequent rate hikes at the press conference. He emphasized the need to observe broader economic and inflation trends, avoiding setting policy direction based on a single monthly data point.
How October Policy Expectations Will Affect Markets?
On the day of the Fed's September decision, 2-year and 10-year Treasury yields rose in tandem. On September 16, the 2-year yield rose 6.5 basis points to 4.725%, reaching a new high since July 2, 2024; the 10-year yield rose 0.8 basis points to 5.003%, reaching its highest level since July 19, 2007.
Yield movements show that the market is assessing the risk of subsequent rate hikes. If the probability of an October rate hike continues to rise, short-term Treasury yields and the U.S. dollar may move further higher.
The U.S. Dollar Index rose by about 0.64% on the day of the decision, closing near 100.25. A stronger dollar will depress multinational corporations' overseas revenues when converted into dollars and increase U.S. dollar debt pressures in emerging markets.
The stock market also reacted to the upward shift in the interest rate path. The Dow Jones Industrial Average fell 1.21%, the S&P 500 Index fell 0.45%, the Nasdaq Composite Index was virtually flat, and the Russell 2000 Index fell about 0.4%. Higher interest rates generally weigh on stock valuations, making high-valuation companies and small-and-medium enterprises reliant on external financing more sensitive.
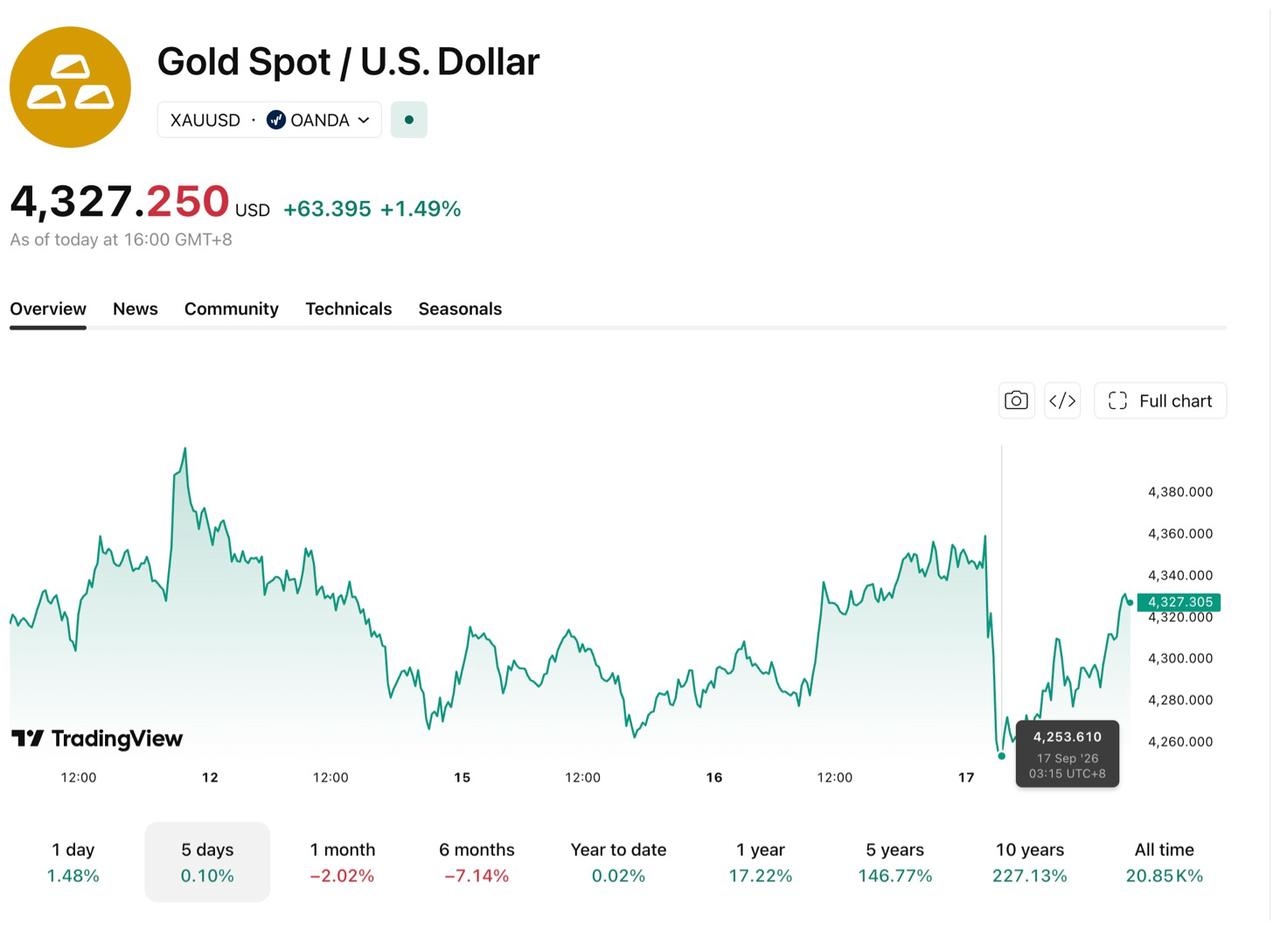
Following the release of the Fed decision, gold futures reversed gains intraday, briefly falling to near $4,253 per ounce. If the dollar and Treasury yields continue to rise, gold prices could come under further pressure.
[Source: TradingView]
The housing market was already facing high financing costs before this rate hike. For the week ending September 11, the average contract rate for a 30-year fixed mortgage in the U.S. rose to 6.97%, the highest since May 2025. Mortgage applications for the week fell 4.1% week-over-week, with refinancing applications dropping 9%.
Ahead of the October meeting, Federal Funds futures will reflect market probability pricing for a rate hike, and 2-year Treasury yields and the U.S. Dollar Index will also adjust along with policy expectations. If August core PCE, September nonfarm payrolls, and September core CPI continue to show elevated inflation and robust employment, the market may increase the probability of an October rate hike; cooling data, however, could shift expectations toward December.
Recommended Articles


