


Silver Price Forecast: XAG/USD jumps to near $64.40 as rally in oil prices hit a pause
- Silver price gains to near $64.40 as oil prices correct amid easing fears of energy supply disruption.
- The Fed hiked interest rates by 25 bps to 3.75%-4.00% on Wednesday.
- The Fed is expected to deliver more interest rate hikes this year.
Silver price (XAG/USD) is up 1.8% to near $64.40 during the European trading session on Thursday. The white metal gains as oil price’s rally hits a pause as Saudi Arabia confirms exploring alternatives for shipping energy.
Saudi Arabia is offering additional crude cargoes to Asian refiners through ship-to-ship transfers off Oman's Sohar port, The Times of India (ToI) reported.
Such a scenario would ease fears of energy supply disruption, which escalated after Saudi Arabia closed its east-west pipeline, following drone attacks.
However, the upside in the Silver is expected to remain limited, as the Federal Reserve’s (Fed) monetary policy outcome on Wednesday signaled that policymakers see more interest rate hikes this year. The Fed hiked interest rates by 25 basis points (bps) to 3.75%-4.00%, as expected, in an attempt to counter prolong hot inflationary pressures.
Strategists at NBC Economics reported that the updated dot plot points to “relatively broad support for more restrictive monetary policy for a significant period of time.” In their view, the Fed “doesn’t see a return to a 3.5% to 3.75% range until the end of 2029,” underscoring a higher-for-longer policy bias.
NBC’s team sees “a 4.25% upper bound target representing the peak of what could be a brief tightening cycle,” with the timing and scale of eventual cuts likely to be “dictated by the sustainability of the economic expansion (i.e., the AI boom).” Importantly, they judge that, “relative to the very gradual easing path laid out in this dot plot, we think risks are skewed to earlier and more significant rate cuts,” suggesting the market may ultimately face a faster normalization than the Fed is currently signaling.
Theoretically, higher interest rates by the Fed bodes poorly for non-yielding assets, such as Silver.
Silver Technical Analysis
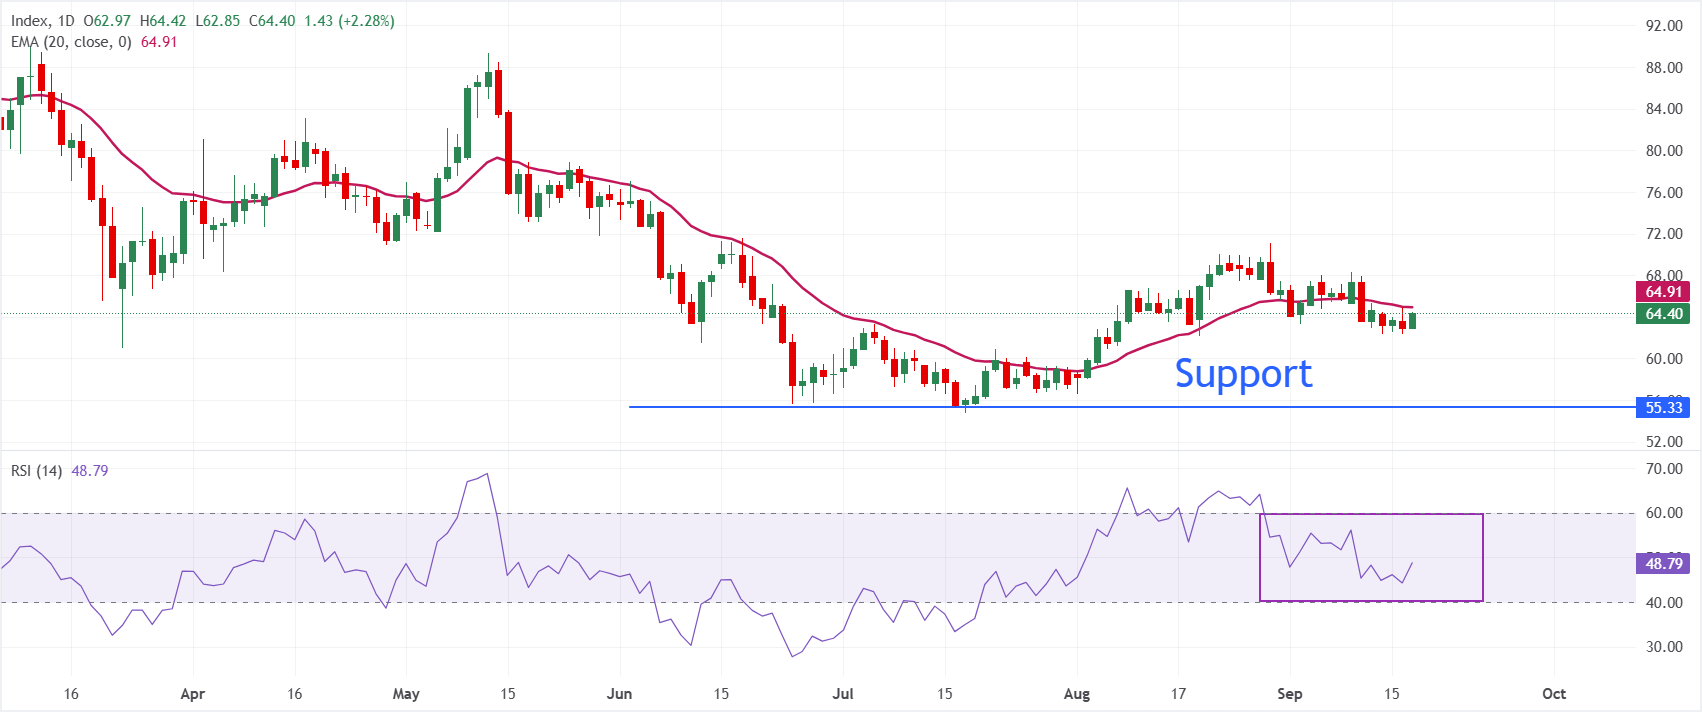
In the daily chart, XAG/USD trades at $64.38, keeping a bearish near-term bias as it holds below the 20-day exponential moving average (EMA) at $64.91. The price action suggests upside attempts are being capped by this dynamic resistance, while the Relative Strength Index (RSI) at 48.73 sits just under the neutral 50 line, hinting at waning momentum rather than outright oversold conditions.
On the topside, the immediate focus is on the 20-day EMA at $64.91, which acts as the first barrier that bulls would need to reclaim to ease the current downside pressure. Looking up, the Silver price could extend the advance towards $68 if it manages to hold above the dynamce EMA.
On the downside, the white metal could slide towards $60 if it resumes the decline below Wednesday's low at $62.30. Below $60, the Silver price could extend the slide to near the July low at $54.77.
(The technical analysis of this story was written with the help of an AI tool. Know more.)
Silver FAQs
Silver is a precious metal highly traded among investors. It has been historically used as a store of value and a medium of exchange. Although less popular than Gold, traders may turn to Silver to diversify their investment portfolio, for its intrinsic value or as a potential hedge during high-inflation periods. Investors can buy physical Silver, in coins or in bars, or trade it through vehicles such as Exchange Traded Funds, which track its price on international markets.
Silver prices can move due to a wide range of factors. Geopolitical instability or fears of a deep recession can make Silver price escalate due to its safe-haven status, although to a lesser extent than Gold's. As a yieldless asset, Silver tends to rise with lower interest rates. Its moves also depend on how the US Dollar (USD) behaves as the asset is priced in dollars (XAG/USD). A strong Dollar tends to keep the price of Silver at bay, whereas a weaker Dollar is likely to propel prices up. Other factors such as investment demand, mining supply – Silver is much more abundant than Gold – and recycling rates can also affect prices.
Silver is widely used in industry, particularly in sectors such as electronics or solar energy, as it has one of the highest electric conductivity of all metals – more than Copper and Gold. A surge in demand can increase prices, while a decline tends to lower them. Dynamics in the US, Chinese and Indian economies can also contribute to price swings: for the US and particularly China, their big industrial sectors use Silver in various processes; in India, consumers’ demand for the precious metal for jewellery also plays a key role in setting prices.
Silver prices tend to follow Gold's moves. When Gold prices rise, Silver typically follows suit, as their status as safe-haven assets is similar. The Gold/Silver ratio, which shows the number of ounces of Silver needed to equal the value of one ounce of Gold, may help to determine the relative valuation between both metals. Some investors may consider a high ratio as an indicator that Silver is undervalued, or Gold is overvalued. On the contrary, a low ratio might suggest that Gold is undervalued relative to Silver.
Recommended Articles


