

This Stock Market Alarm Is the Loudest It’s Been in 25 Years. Here's Where History Says the S&P 500 Is Headed.
Key Points
The Shiller CAPE ratio measures the value of the S&P 500 relative to earnings growth over a long-term period.
Typically, the S&P 500 has sold off after the CAPE ratio reaches a reading between 35 and 40.
The CAPE ratio currently hovers around 40, its second-highest level in history.
- 10 stocks we like better than S&P 500 Index ›
After a harsh sell-off earlier this year, the S&P 500 (SNPINDEX: ^GSPC) has entered a steady climb propelled by enthusiasm around artificial intelligence (AI). Yet beneath the surface of record highs lies a cautionary signal that most investors overlook: The cyclically adjusted price-to-earnings (CAPE) ratio is hovering at unusually high levels.
Popularized by economist Robert Shiller, this metric provides a sobering lens through which to value the capital markets. Understanding the CAPE ratio is critical for smart investors, as it underscores how stretched current prices have become relative to historical norms -- prompting questions about what comes next.
Will AI create the world's first trillionaire? Our team just released a report on the one little-known company, called an "Indispensable Monopoly" providing the critical technology Nvidia and Intel both need. Continue »

Image source: Getty Images.
What is the CAPE ratio, and why is it important?
The CAPE ratio measures the current price of the S&P 500 divided by the average of inflation-adjusted earnings per share (EPS) over the past 10 years. Unlike the standard price-to-earnings (P/E) ratio, which relies on a single year's earnings and can swing dramatically along with economic booms, recessions, or one-off events, the CAPE ratio smooths out cyclical distortions. In essence, the CAPE ratio accounts for both good and bad business cycles, offering a more stable gauge of whether stocks are reasonably priced or overvalued on a normalized basis.
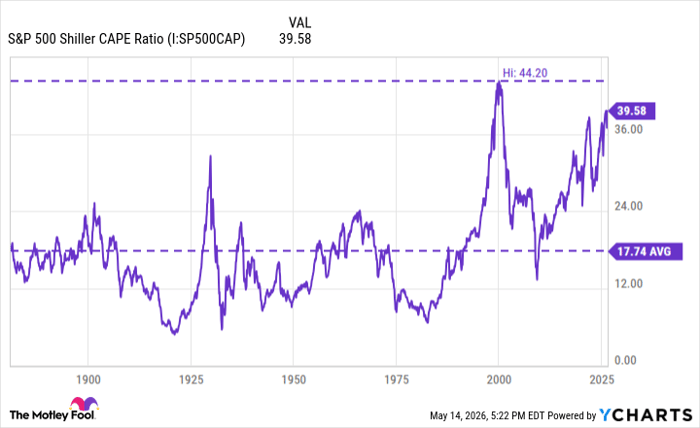
S&P 500 Shiller CAPE Ratio data by YCharts
The S&P 500's CAPE ratio currently hovers near 40. To put this in context, the long-term average sits around 18, with typical readings in the mid-to-high 20s during bull markets. The current level exceeds all but the late-1990s dot-com peak of 44.
Per the chart, investors can see that high CAPE readings have historically preceded periods of muted or even negative returns over the following years. Meanwhile, low readings have created attractive buying opportunities.
What is driving the CAPE ratio higher?
For the last several years, the S&P 500 has been buoyed by outsize enthusiasm for AI stocks. Sandisk (NASDAQ: SNDK), whose flash storage products are vital to the proliferation of AI, is up more than 400% this year to lead the index. But other companies at the forefront of AI infrastructure, semiconductors, and cloud software platforms have also achieved consistently robust earnings growth.
Market concentration has amplified these dynamics. The long-term growth of the "Magnificent Seven" stocks means those megacap tech leaders make up roughly one-third of the S&P 500, and the index's 35% weighting in the information technology sector has pushed its overall multiple higher even as broader corporate earnings remain solid but not commensurately explosive.
Recent reductions in interest rates have freed up liquidity, and the narrative that AI is a once-in-a-generation revolution has only further encouraged investors to pay premium prices. The result is valuation expansion that might feel justified in the moment but strangely echoes episodes of past exuberance.
Will the stock market crash in 2026?
History offers a clear pattern after the CAPE ratio peaks. When it climbs between 35 and 40, annualized returns have typically been low over the next decade -- often in the low single digits or even negative.
The most recent precedent is the dot-com era. After the market peaked between 1999 and 2000, the S&P 500 suffered a roughly 49% drawdown over the next two years, followed by a decade of modest gains. Similar dynamics played out before the 1929 crash.
The common thread here is mean reversion, with stock prices eventually adjusting to more reasonable earnings multiples.
All this said, a full-scale crash similar to 2000 or 1929 is not guaranteed. Even without a crash, a harsh, prolonged sell-off remains a plausible risk if earnings disappoint or sentiment around growth shifts. Given these realities, smart investors should prudently allocate capital with discipline.
First, build a diversified portfolio beyond the S&P 500's tech-heavy concentration. Second, complementing your stock positions with bonds and cash can provide dry powder for opportunistic buying during corrections. Third, employ a dollar-cost-averaging approach and rebalance your portfolio regularly. Finally, keep a long-term horizon at the center of your investment goals.
Focusing on businesses with durable competitive advantages rather than speculative growth stories should help keep you insulated from volatility in the long run.
Should you buy stock in S&P 500 Index right now?
Before you buy stock in S&P 500 Index, consider this:
The Motley Fool Stock Advisor analyst team just identified what they believe are the 10 best stocks for investors to buy now… and S&P 500 Index wasn’t one of them. The 10 stocks that made the cut could produce monster returns in the coming years.
Consider when Netflix made this list on December 17, 2004... if you invested $1,000 at the time of our recommendation, you’d have $469,293!* Or when Nvidia made this list on April 15, 2005... if you invested $1,000 at the time of our recommendation, you’d have $1,381,332!*
Now, it’s worth noting Stock Advisor’s total average return is 993% — a market-crushing outperformance compared to 207% for the S&P 500. Don't miss the latest top 10 list, available with Stock Advisor, and join an investing community built by individual investors for individual investors.
See the 10 stocks »
*Stock Advisor returns as of May 16, 2026.
Adam Spatacco has no position in any of the stocks mentioned. The Motley Fool has no position in any of the stocks mentioned. The Motley Fool has a disclosure policy.
Recommended Articles


