Pi Network Price Forecast: PI defends $0.0800 support as selling pressure mounts

Source Fxstreet
  • Pi Network hovers above $0.0800 on Monday, extending the losses from the previous day.
  • Retail speculation surrounding the PI token is easing, with the Open Interest below $9 million.
  • The technical outlook for the PI token is bearish, at risk of breaking below the $0.0800 support level.

Pi Network (PI) is trading in the red on Monday, hovering above $0.0800 as selling pressure mounts. PI token’s speculative demand is easing, with Open Interest below $9 million despite rising social chatter, hinting at panic-driven buzz among investors. The technical outlook for PI suggests a bearish bias, with the risk of breaking below the $0.0800 support level. 

Retail support declines

Pi Network sees a decline in retail speculation from last week. CoinAnk data shows the PI futures Open Interest (OI) at $8.86 million on Monday, down from $10.52 million last week, suggesting a reduced notional value of active positions, driven by a declining spot price or a positional wipeout. In either case, this indicates a reduced retail participation, which is crucial for speculation-driven tokens like PI.

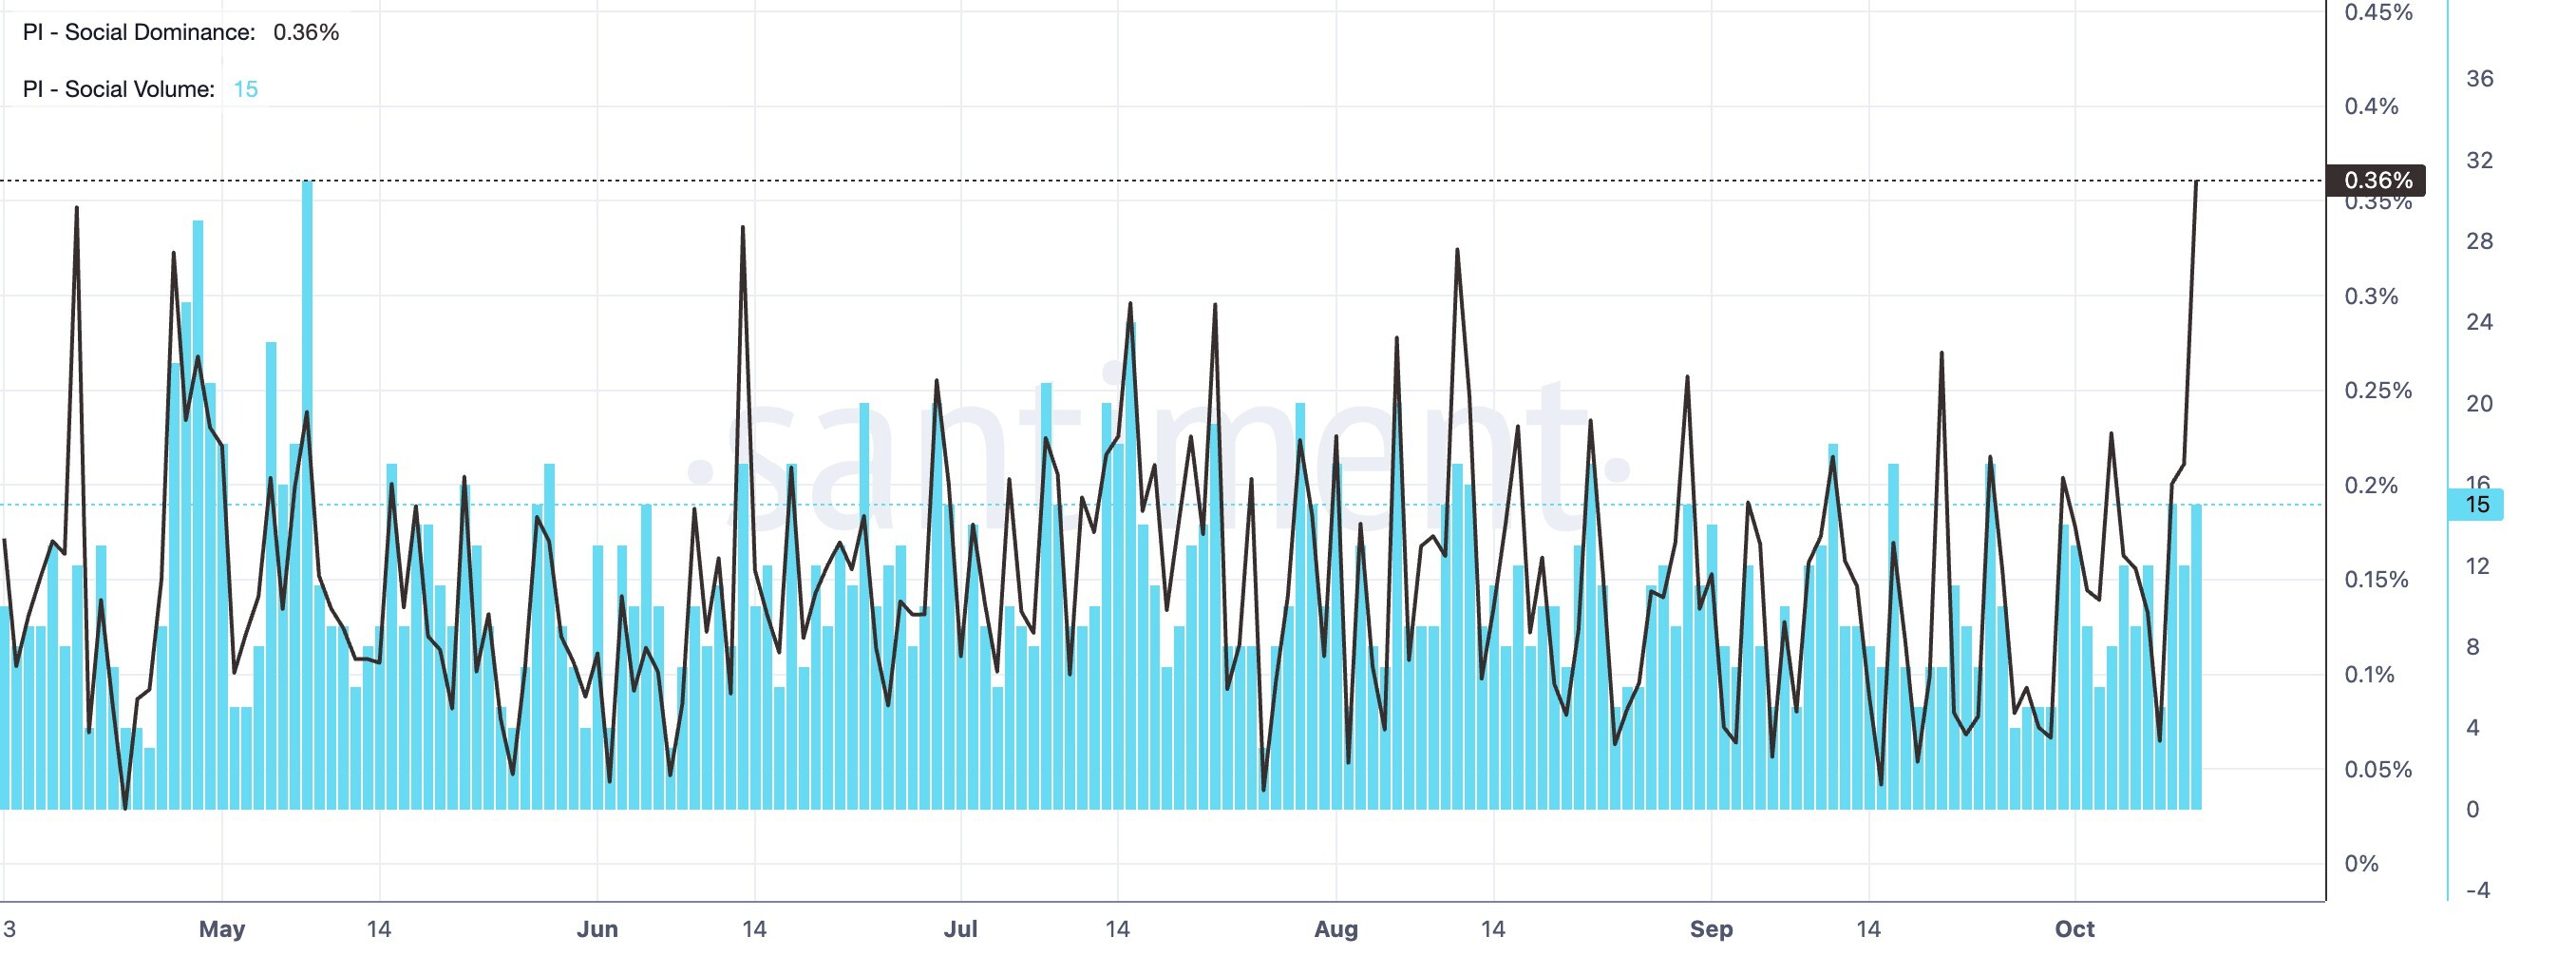
On the other hand, the market chatter surrounding the PI token is elevated, with Santiment’s data showing PI's social dominance score at 0.36% on Sunday, up from 0.06% on Thursday. The decline in retail activity, despite elevated market buzz around PI, reaffirms a bearish bias in investor sentiment. 
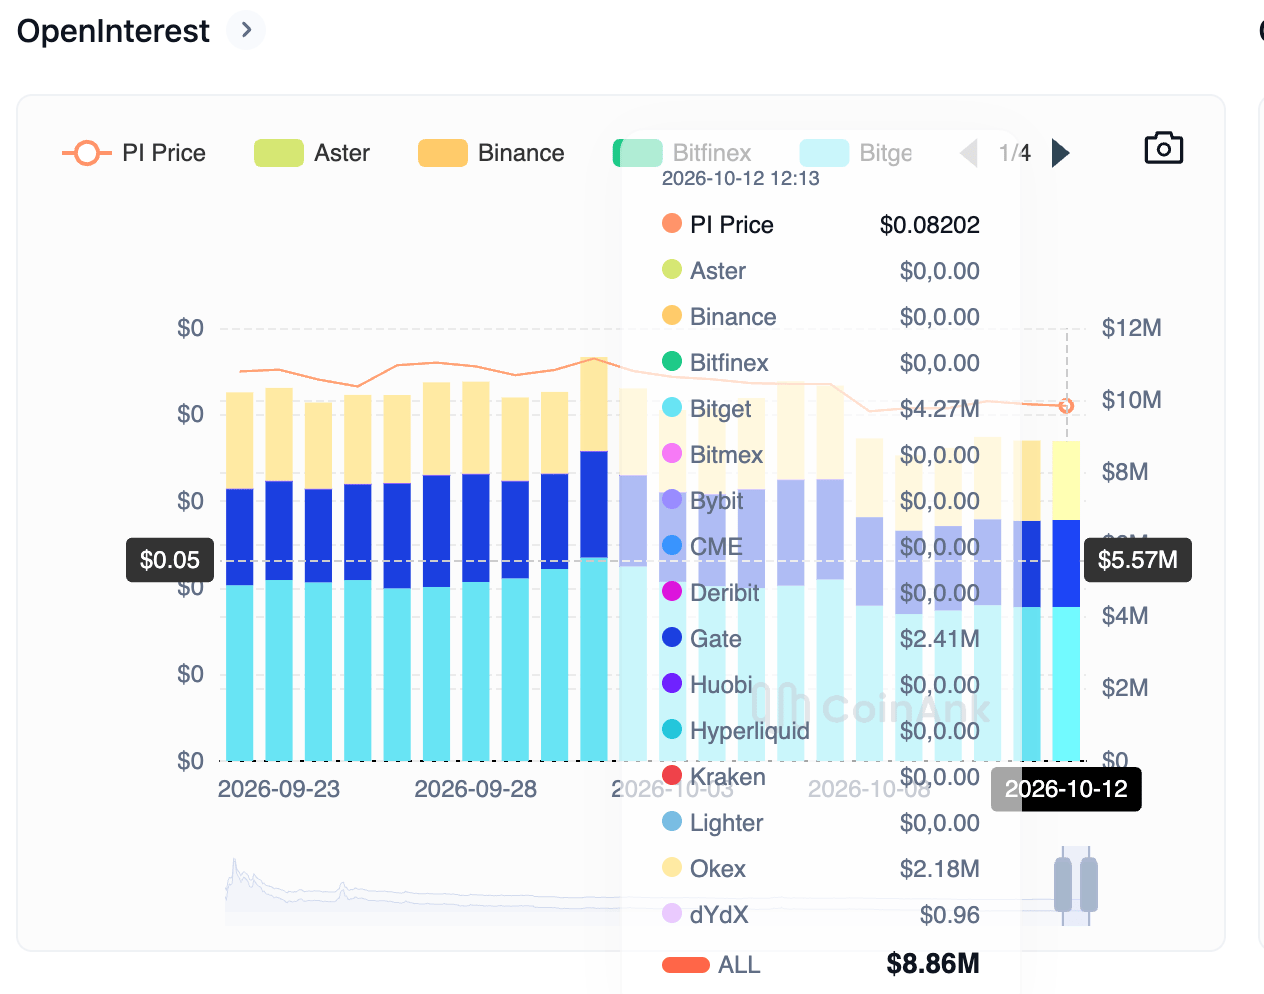
PI token Open Interest chart. Source: CoinAnk
PI social interest data. Source: Santiment

Technical outlook: Will PI defend its $0.080 support level?

Pi Network trades above $0.0800 at press time on Monday, holding steady above its crucial support level set by the July 31 low. The PI token extends a bearish near-term bias as price holds well below the 50- and 200-day Exponential Moving Averages (EMAs) at $0.0889 and $0.1230, respectively.

PI remains beneath a descending trendline, connecting the June 20 and August 22 highs, near $0.0880. The pair also trades under the 23.6% Fibonacci retracement at $0.0867, measured from $0.1394 to $0.0704, keeping it confined to the lower end of the recent range.

In addition, the roughly 7% decline on Wednesday broke below the short-term rising support trendline, connecting the July 14 and September 16 lows, near $0.0836, which also capped gains on Saturday.

Momentum remains bearish on the daily chart, with the Relative Strength Index (RSI) declining to 39, below the midline, while the slightly negative Moving Average Convergence Divergence (MACD) suggests that downside momentum is still present.

A confirmed breakout below the $0.0800 level could extend the decline toward the $0.0704 swing low. Any deeper pullback will push PI deeper into untested waters.

Chart Analysis PI/USD (baha Crypto)
PI/USD daily price chart.

On the topside, initial resistance is clustered around the 23.6% Fibonacci retracement, the descending trendline, and the 50-day EMA near $0.0866, $0.0880, and $0.0889, respectively. A daily close above this band would open the way toward the 50% retracement level at $0.1049.

(The technical analysis of this story was written with the help of an AI tool. Know more.)

Disclaimer: For information purposes only. Past performance is not indicative of future results.
placeholder
Hurricane Isaias has shut in a quarter of Gulf oil output — can WTI clear $92 before Thursday's EIA report?WTI trades at $90.80 after rebounding roughly 3% from Wednesday's $87.96 low as Hurricane Isaias — the Atlantic season's first — forces producers to shut in about 25% of US Gulf of Mexico output. Brent holds at $103.41. The first official read on the disruption arrives with the EIA weekly petroleum report on Thursday 15 October — here are the key levels and both scenarios.
Author  Irene Q.
Oct 09, Fri
WTI trades at $90.80 after rebounding roughly 3% from Wednesday's $87.96 low as Hurricane Isaias — the Atlantic season's first — forces producers to shut in about 25% of US Gulf of Mexico output. Brent holds at $103.41. The first official read on the disruption arrives with the EIA weekly petroleum report on Thursday 15 October — here are the key levels and both scenarios.
placeholder
US September CPI preview: inflation set to hit 3.7% — will the Fed hike in December?US September CPI lands Wednesday with headline inflation seen at 3.7% y/y and core at 0.2% m/m. December hike odds sit near 70% — here are the scenarios, the calendar and the key levels.
Author  Irene Q.
Oct 10, Sat
US September CPI lands Wednesday with headline inflation seen at 3.7% y/y and core at 0.2% m/m. December hike odds sit near 70% — here are the scenarios, the calendar and the key levels.
placeholder
Gold posts first weekly gain in three weeks — can $4,200 hold through CPI?Spot gold closed at $4,194.645, up 1.47% — its first weekly gain in three weeks — and COMEX futures settled back above $4,200 at $4,220.30. Here are the drivers, the levels and the scenarios into Wednesday's CPI.
Author  Irene Q.
Oct 10, Sat
Spot gold closed at $4,194.645, up 1.47% — its first weekly gain in three weeks — and COMEX futures settled back above $4,200 at $4,220.30. Here are the drivers, the levels and the scenarios into Wednesday's CPI.
placeholder
WTI declines to near $90.00 despite escalating Middle East conflict, supply risksWest Texas Intermediate (WTI) declines after two days of gains, trading around $90.00 per barrel during Asian hours on Monday.
Author  FXStreet
12 hours ago
West Texas Intermediate (WTI) declines after two days of gains, trading around $90.00 per barrel during Asian hours on Monday.
placeholder
Brent swings $105.63 to $102.33 as Gulf risk meets an 'energy ceasefire' — can $100 hold into CPI?Brent spiked to $105.63 in Asian trade on fresh Middle East supply incidents, then reversed to $102.33 after the US announced a Russia-Ukraine 'energy ceasefire' and 300,000+ tonnes of Russian diesel headed to global markets; WTI fell through $90. Here are the drivers, the levels and the scenarios into Wednesday's US CPI.
Author  Irene Q.
7 hours ago
Brent spiked to $105.63 in Asian trade on fresh Middle East supply incidents, then reversed to $102.33 after the US announced a Russia-Ukraine 'energy ceasefire' and 300,000+ tonnes of Russian diesel headed to global markets; WTI fell through $90. Here are the drivers, the levels and the scenarios into Wednesday's US CPI.
goTop
quote