

Bitcoin Price Prediction: BTC Holds $86,000 as Sustained ETF Inflows Could Push It Past $90,000

Source Tradingkey

TradingKey - As of the Asian session on September 23, Bitcoin (BTC) price continued its recent strong performance, with the latest price trading near $86,500, up about 0.3% on the day. Bitcoin reached a high of $87,395 this Monday, setting a near eight-month high. Although profit-taking emerged thereafter, the price remained stably above $85,000. Compared to the low near $76,000 on September 17, Bitcoin's cumulative rebound has exceeded 13%.

ETF Funds See Continuous Inflows as Falling Oil Prices Improve Risk Appetite

From a fundamental perspective, the core factor driving the recent continuous rise in Bitcoin prices is the sustained inflow of capital into ETFs.

Data from Farside Investors shows that US spot Bitcoin ETFs recorded net inflows of approximately $433 million on September 18, which further reached $999 million on September 21, and continued to see an inflow of about $364 million on September 22, bringing cumulative net inflows over the three trading days to nearly $1.8 billion. The previous ETF outflows triggered by setbacks with the CLARITY Act and Federal Reserve interest rate hikes have clearly reversed, with institutional demand once again becoming a key force driving BTC past $80,000.

The macroeconomic environment has also shown some improvement recently. Renewed expectations of US-Iran negotiations, coupled with the resumption of operations on a Saudi oil pipeline, led to a noticeable drop in international oil prices. Lower oil prices helped ease market concerns that energy costs could drive US inflation higher again, while the 10-year US Treasury yield also retreated, providing overall support for risk assets. On Monday, the Nasdaq Composite Index hit a record closing high, and Bitcoin surged over 6% during the same period, indicating that the current BTC rally remains clearly driven by improving risk appetite.

However, Federal Reserve policy remains a major risk going forward. Officials such as Richmond Fed President Barkin have recently continued to emphasize inflationary pressures, and the market probability of another Fed rate hike in October remains around 50%.

Overall, continuous ETF capital inflows and falling oil prices provide upward momentum for Bitcoin, but the risk of further Fed rate hikes continues to limit valuation expansion. If ETFs maintain net inflows while US Treasury yields do not rise significantly again, the foundation remains in place for Bitcoin's current rebound to continue.

Bitcoin Price Technical Analysis
btc-9f78ff36422d4ba5afae0fc8983b1710

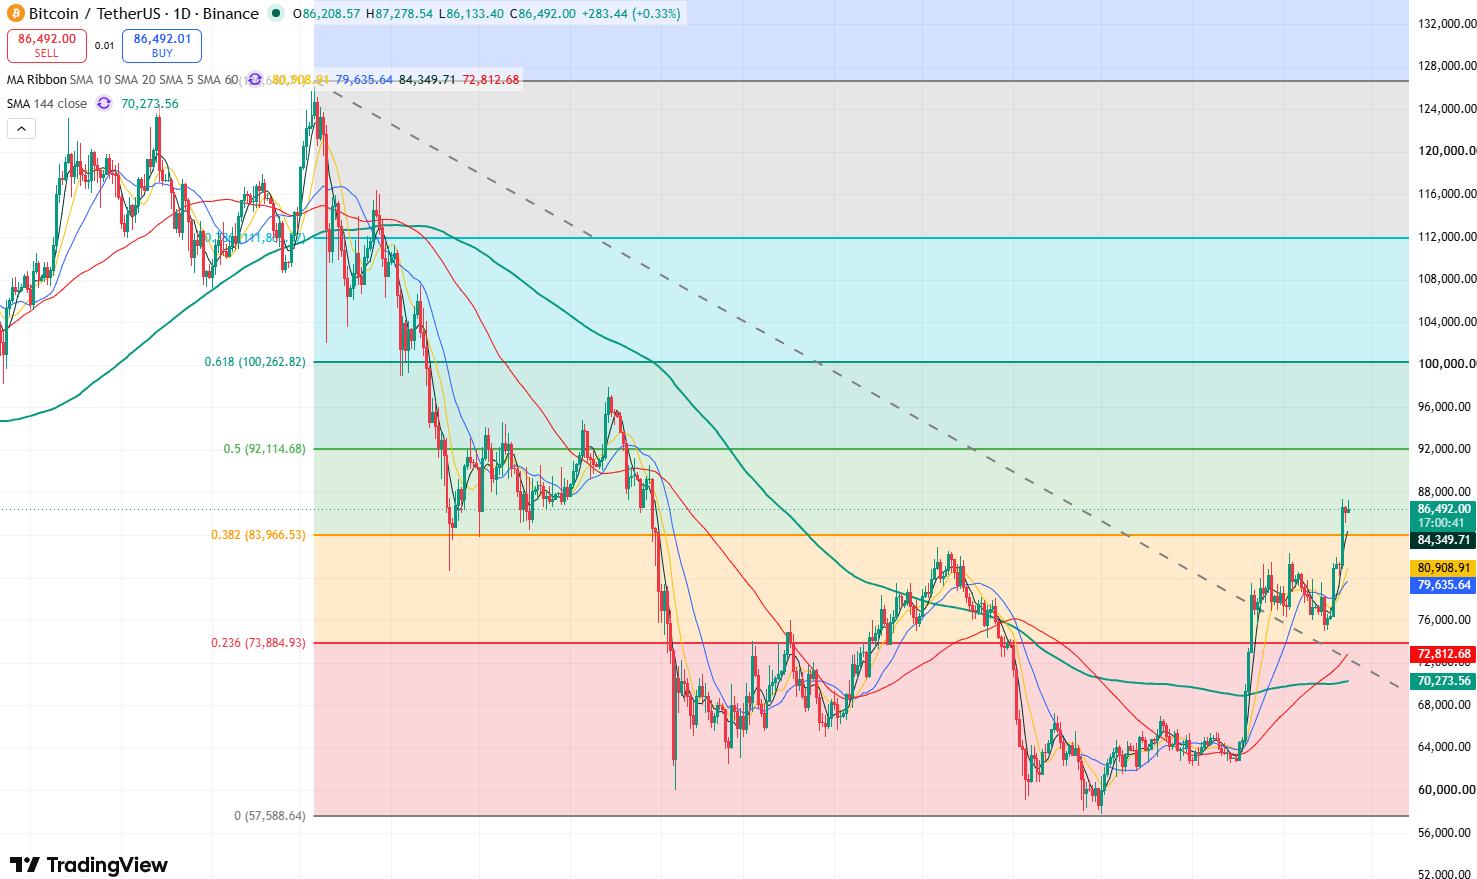
Bitcoin price daily chart, Source: TradingView

Looking at Bitcoin's daily chart, Bitcoin has effectively broken above the $80,000-$83,000 range that previously suppressed prices for a long period, and has reclaimed $85,000. The short-term upward structure has significantly improved, with market bullish momentum markedly strengthened.

Currently, as Bitcoin broke above the $83,000 resistance level, its candlestick structure broke the downtrend in place since October 2025. It may sustain its gains in the short term, with the primary target testing upward toward $90,000-$92,000. If Bitcoin breaks out and holds firmly above $92,000, it will further open up upside space toward $98,000-$100,000.

On the downside, the primary support level to watch below is $81,000-$83,000. If it falls below $81,000, Bitcoin may test the support zone near $75,000.

Disclaimer: For information purposes only. Past performance is not indicative of future results.
placeholder
Dollar index tops 100 for the first time since July as the Fed's hawkish dot plot sinks inThe U.S. dollar index broke back above 100 for the first time since 31 July after the Fed delivered its first rate hike since 2023, with the dot plot showing 16 of 18 officials expect at least one more increase this year. Here are the levels that matter for DXY, the currencies feeling it most, and what to watch next.
Author  Irene Q.
Sep 17, Thu
The U.S. dollar index broke back above 100 for the first time since 31 July after the Fed delivered its first rate hike since 2023, with the dot plot showing 16 of 18 officials expect at least one more increase this year. Here are the levels that matter for DXY, the currencies feeling it most, and what to watch next.
placeholder
Gold ends three-week slide at the $4,400 line — eight straight days of ETF inflows vs a 5% 10-year and a 100 dollarSpot gold closed Friday at $4,378.39, up 0.84% on the day and about 0.8% for the week — its first weekly gain in four weeks — with the intraday high of $4,399.67 leaving it 33 cents shy of the $4,400 line. Gold ETFs have now logged eight straight sessions of inflows, but with the 10-year back above 5% and the dollar index near 100, here is what decides whether this is a reversal or a bounce.
Author  Suzie
Sep 20, Sun
Spot gold closed Friday at $4,378.39, up 0.84% on the day and about 0.8% for the week — its first weekly gain in four weeks — with the intraday high of $4,399.67 leaving it 33 cents shy of the $4,400 line. Gold ETFs have now logged eight straight sessions of inflows, but with the 10-year back above 5% and the dollar index near 100, here is what decides whether this is a reversal or a bounce.
placeholder
October hike odds climb toward 60% as Goldman and BofA both flip — what Warsh's "dose of accommodation" really changedRate futures now price roughly 55% to 62% for a 25bp hike at the October 27-28 FOMC, up from about 30% before Chair Warsh's post-meeting framing that the Fed is merely "removing some accommodation." Goldman Sachs has added an October hike to its forecast and Bank of America now sees moves in both October and December. Here is the repricing, the language behind it, and the two data points that decide it.
Author  Irene Q.
17 hours ago
Rate futures now price roughly 55% to 62% for a 25bp hike at the October 27-28 FOMC, up from about 30% before Chair Warsh's post-meeting framing that the Fed is merely "removing some accommodation." Goldman Sachs has added an October hike to its forecast and Bank of America now sees moves in both October and December. Here is the repricing, the language behind it, and the two data points that decide it.
placeholder
Memory chips surge, Nasdaq notches a second straight record close — why the Dow fell 185 points anywayMicron gained 5%, SanDisk 6.8%, Seagate 4% and Western Digital 3% as the memory complex led the Nasdaq Composite to a second consecutive record close of 27,244.28. But the Dow fell 185 points as JPMorgan, Wells Fargo and Schwab slid more than 3% each — a split tape that says more about positioning than about the economy.
Author  Irene Q.
17 hours ago
Micron gained 5%, SanDisk 6.8%, Seagate 4% and Western Digital 3% as the memory complex led the Nasdaq Composite to a second consecutive record close of 27,244.28. But the Dow fell 185 points as JPMorgan, Wells Fargo and Schwab slid more than 3% each — a split tape that says more about positioning than about the economy.
placeholder
Gold Price Forecast: XAU/USD drifts toward $4.300 with bears gaining tractionGold (XAU/USD) retraces Tuesday’s gains on Wednesday and drifts lower, approaching the $4,300 area as the US Dollar Index (DXY) rallies further amid high US Treasury yields.
Author  FXStreet
14 hours ago
Gold (XAU/USD) retraces Tuesday’s gains on Wednesday and drifts lower, approaching the $4,300 area as the US Dollar Index (DXY) rallies further amid high US Treasury yields.
goTop
quote