


Top Altcoins Price Prediction: Bitcoin Cash, BitcoinSV, and LayerZero rallies push higher
- Bitcoin Cash shows a mild easing on Wednesday, following a nearly 30% jump the previous day.
- BitcoinSV is up 8% on the day, building on the 28% gains recorded earlier this week.
- LayerZero holds steady at a four-month high around $1.39 after advancing nearly 18% the previous day.
Top altcoins, including Bitcoin Cash (BCH), BitcoinSV (BSV), and LayerZero (ZRO), are up in double digits over the last 24 hours, suggesting a potentially stable upward trend. BCH reclaims the $300 threshold, scaling to a three-month high while BSV and ZRO are trading at their annual and four-month highs, respectively. The technical outlook for these altcoins is bullish, as the upside momentum gains traction while a capital rotation from major cryptocurrencies hints at the early stages of an altseason.
Bitcoin Cash rally surpasses $300
Bitcoin Cash skyrocketed by almost 30% on Tuesday, following the announcement that CME Group is listing BCH and Uniswap (UNI) futures, which could drive liquidity.

BCH trades around $340 on Tuesday, holding its firm bullish stance well above the 50-day, 100-day, and 200-day Exponential Moving Averages (EMAs) at $247, $257, and $309, respectively.
The recovery has also reclaimed the 50% retracement of the downswing from $489 to $181 at $297, which now underpins the advance. The path of least resistance highlights the 78.6% Fibonacci retracement level at $395, near the $400 round figure, as the next bullish target.
Momentum remains constructive on the daily chart, with Relative Strength Index (RSI) at 77 and the Moving Average Convergence Divergence (MACD) line and positive histogram rising above zero. Taken together, the indicators suggest an overbought yet persistent upside momentum.
On the downside, initial support is seen at the 200-day EMA at $309, followed by the 50% retracement level at $297.
BitcoinSV at an annual high might have more gas in the tank
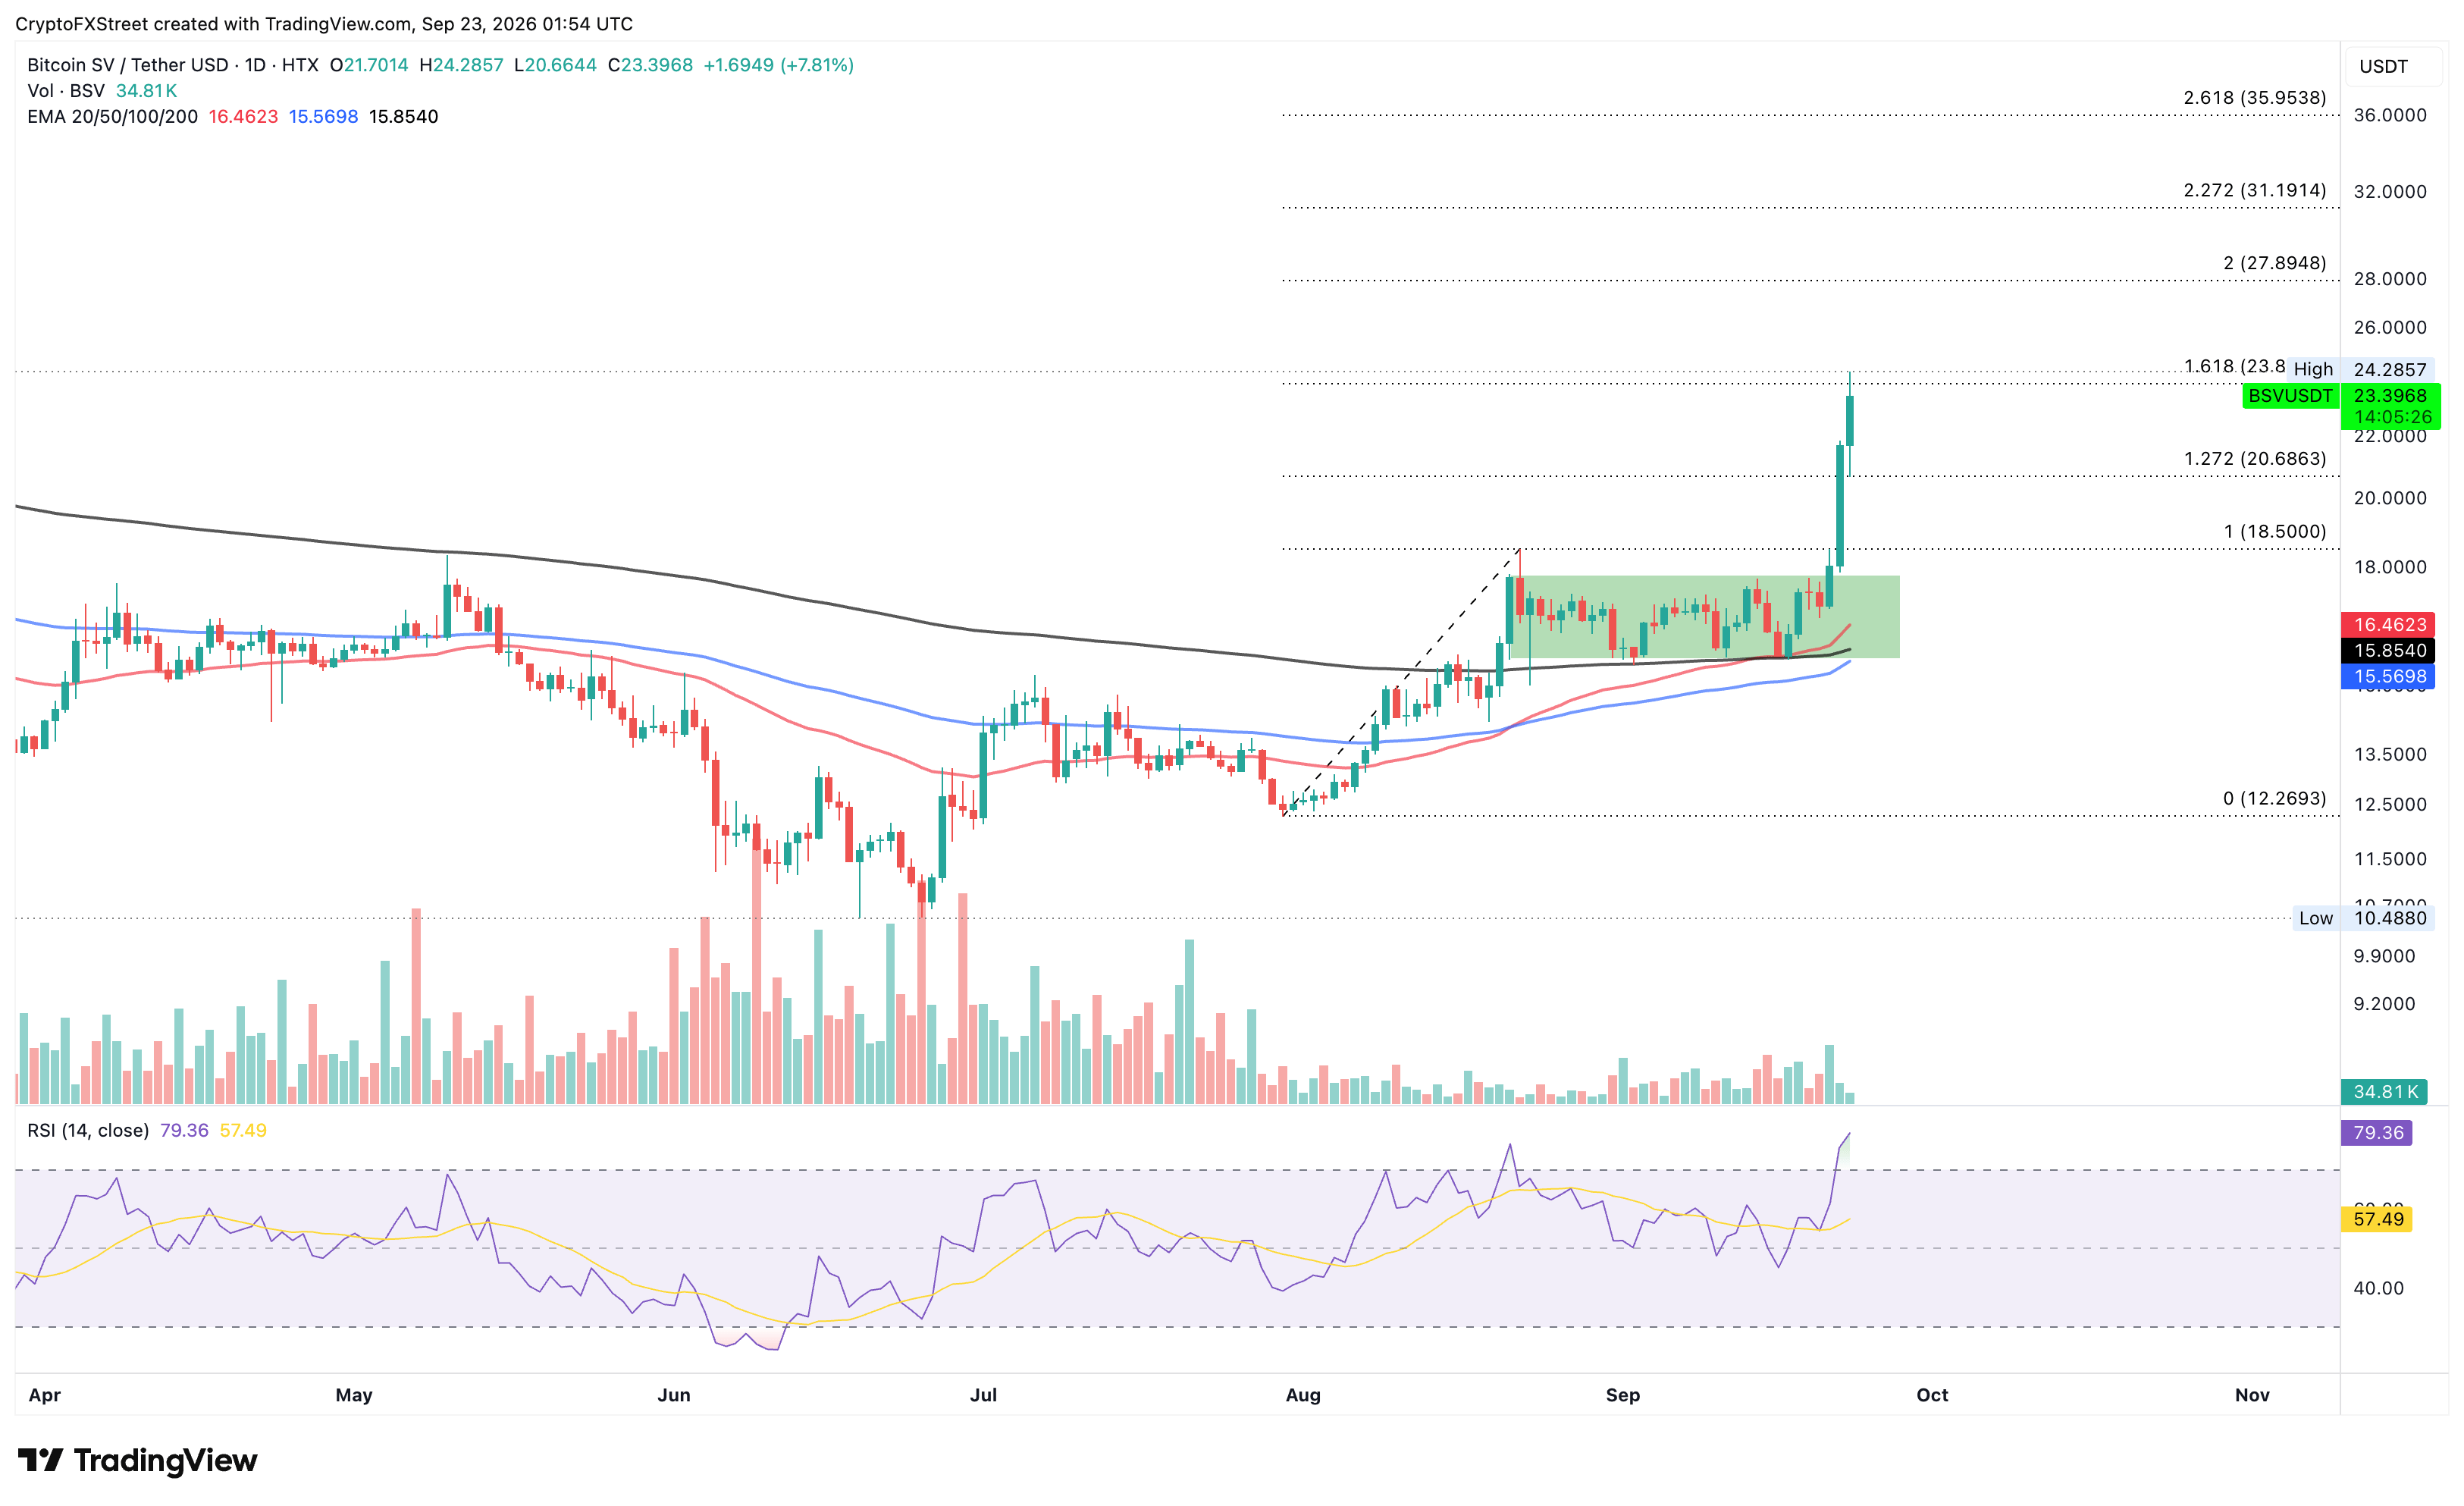
BitcoinSV, a hard fork of Bitcoin Cash, shows a bullish correlation to the news of CME Group listing BCH futures. BSV is up nearly 8% on Wednesday, extending its 20% rise from the previous day.
The altcoin shows a strong bullish phase after breaking well above its 50-day EMA at $16.46, with the 100-day EMA at $15.56 and the 200-day EMA at $15.85 now sitting comfortably below price, suggesting a firmly supported uptrend.
Momentum is stretched, with the RSI hovering above 81 on the daily chart, suggesting a higher likelihood of a pullback as upside momentum stretches thin.
The next notable structural hurdle for BSV, based on the Fibonacci retracement from $12.26 to $18.50, is the 161.8% Fibonacci extension level at $23.84. A confirmed breakout above this level could target the 200% extension level at $27.89.
Looking down, the initial demand is reinforced by the 127.2% extension level and the Fibonacci anchor at $20.68 and $18.50, respectively.
LayerZero gains further ground as buying momentum persists
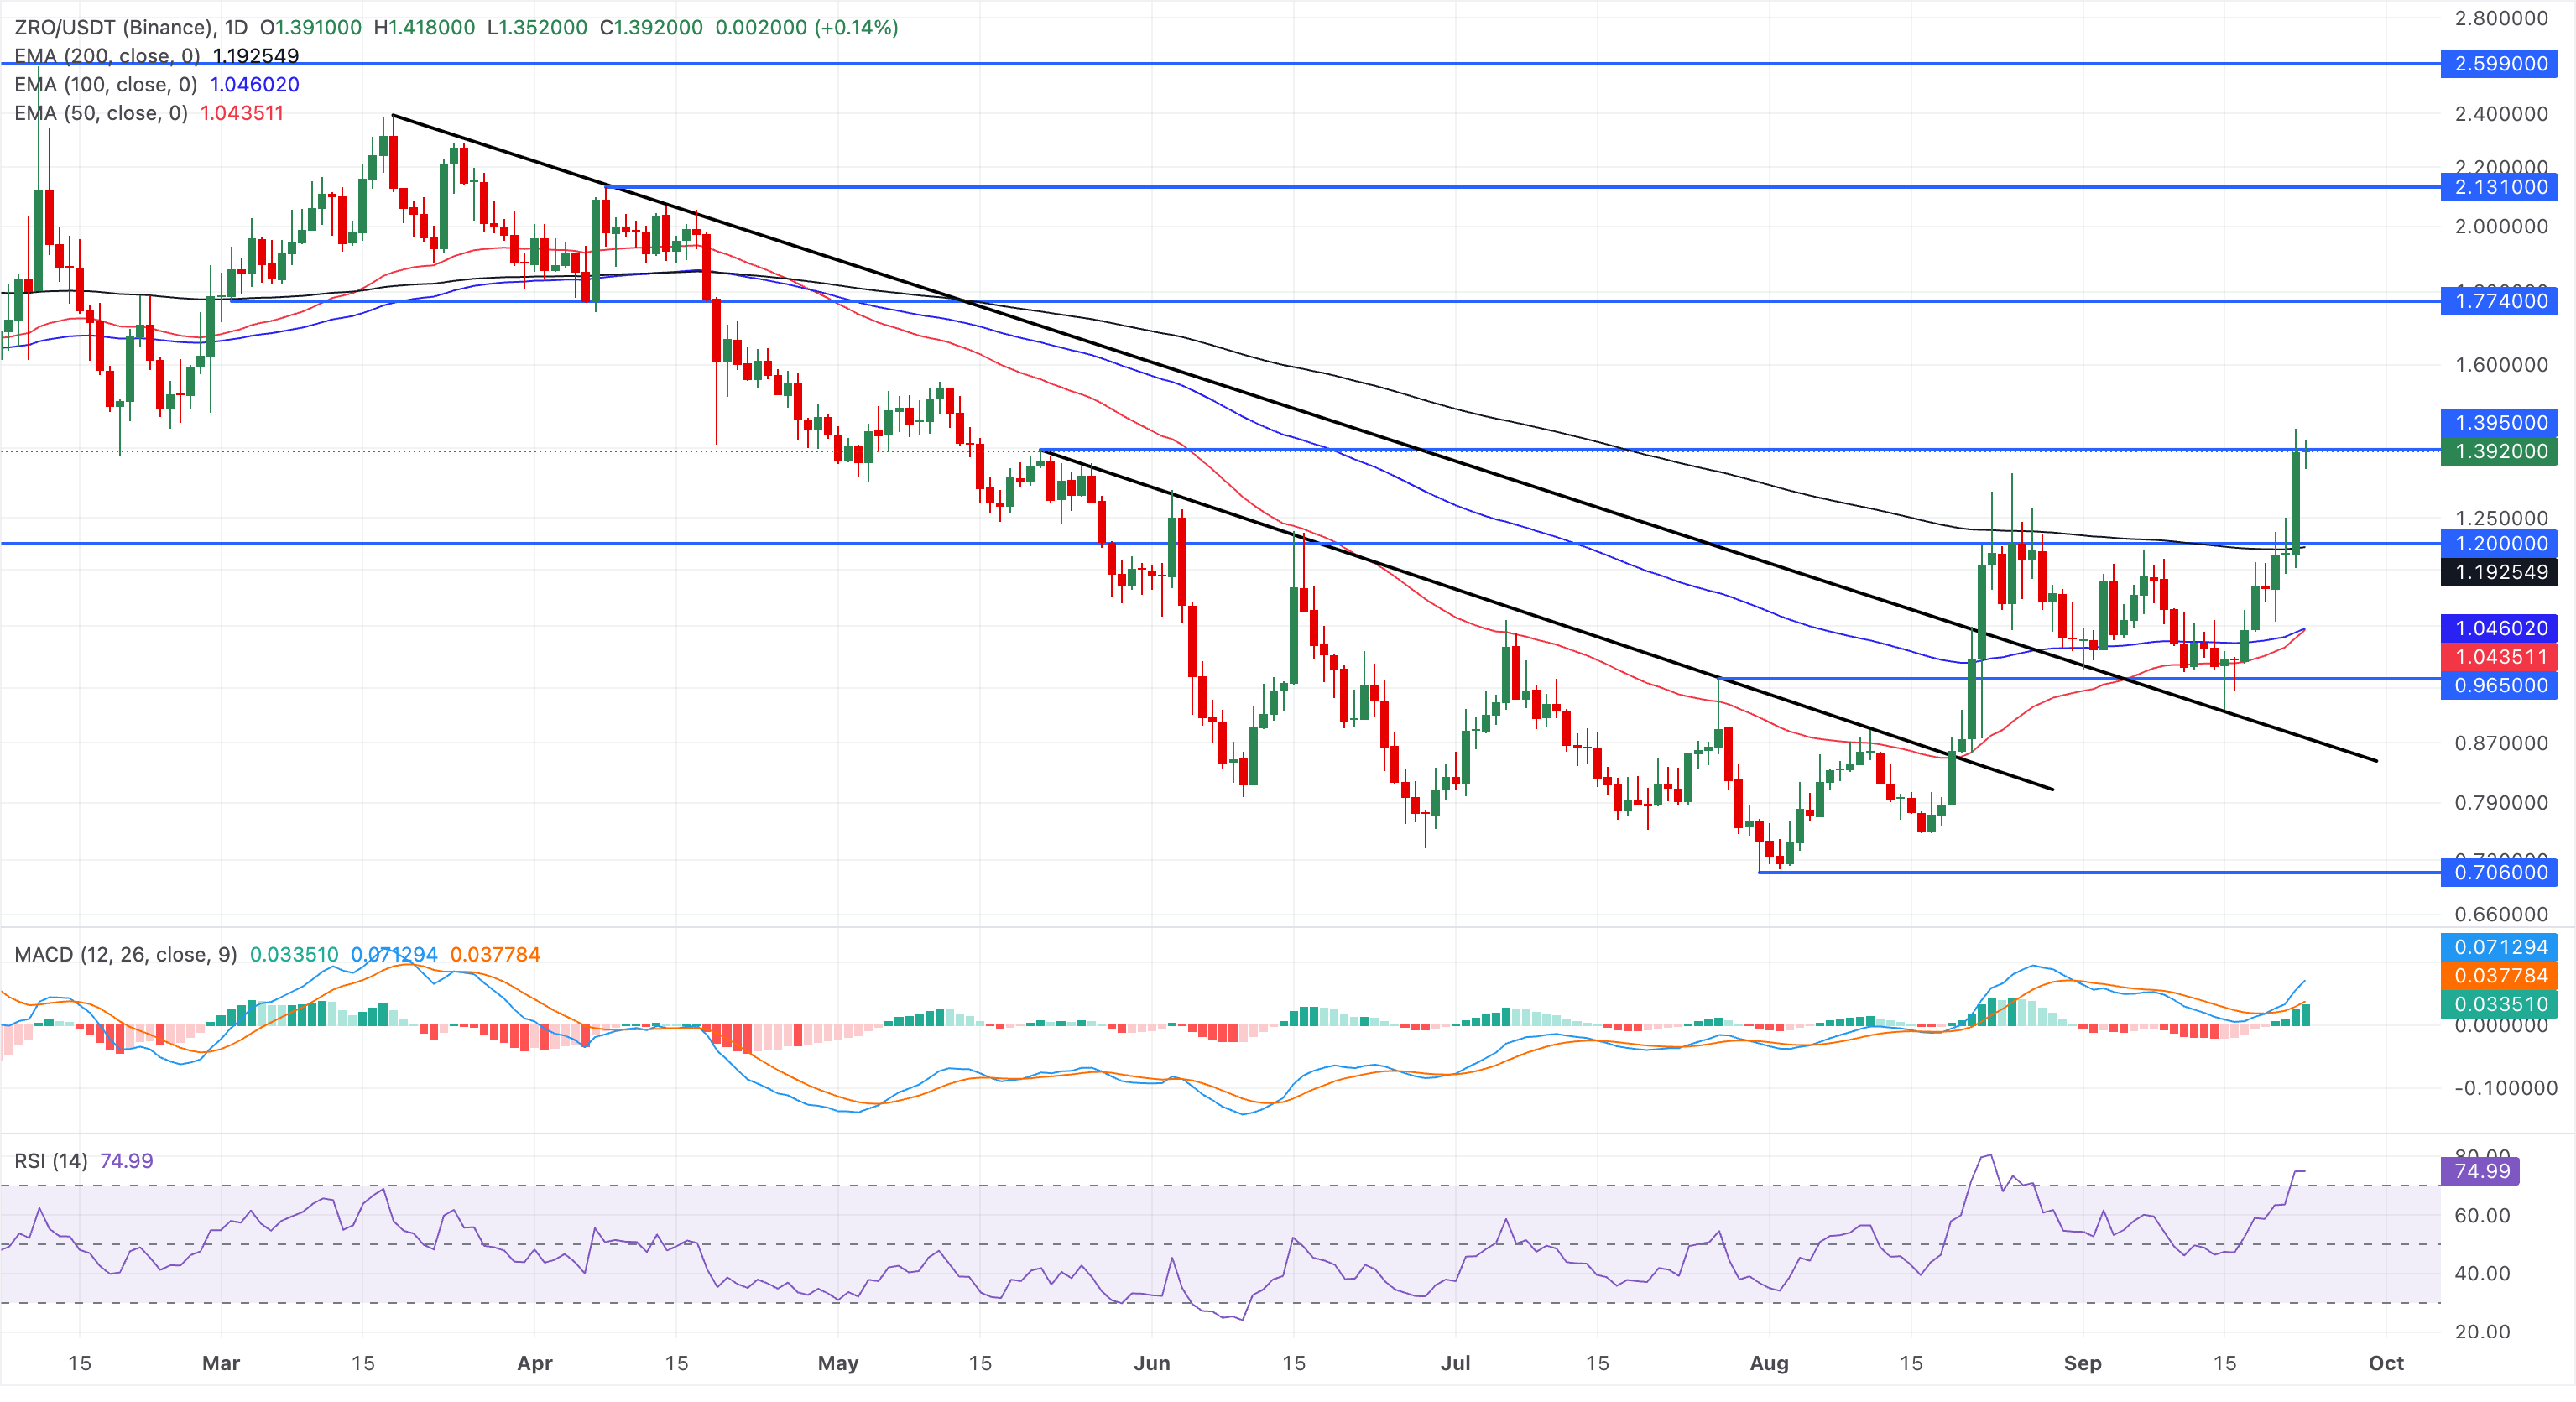
LayerZero trades around $1.3920, holding steady after a roughly 18% rise the previous day. ZRO token extends a strong bullish phase above its major exponential moving averages.
The 50-day EMA at $1.0435, the 100-day EMA at $1.0460, and the 200-day EMA around $1.1925 all sit well below spot, reinforcing an upside-skewed structure. ZRO rally challenges a horizontal resistance set by the May 21 high near $1.3950. A confirmed breakout above this level could target the support-turned-resistance at the March 2 low of $1.7740.
The RSI hovers near 75 on the daily chart, indicating overbought conditions, while the MACD continues to advance in positive territory.
On the flip side, initial support emerges at the 200-day EMA around $1.1925, ahead of a broader demand band around the clustered 100-day EMA at $1.0460 and the 50-day EMA at $1.0435, where dip-buying interest is likely to reappear if price unwinds from current elevated levels.
(The technical analysis of this story was written with the help of an AI tool. Know more.)
Recommended Articles


