

Dogecoin Price Forecast: DOGE rally reclaims $0.10 as buying pressure mounts

Source Fxstreet
  • Dogecoin holds steady around $0.10 on Tuesday, following a 14% jump the previous day.
  • DOGE-focused ETFs recorded over $900,000 in inflows on Monday, indicating renewed institutional confidence.
  • The technical outlook for DOGE indicates an upside bias as bulls focus on breaking above the supply barrier at $0.10.

Dogecoin (DOGE) price steadies around $0.10 on Tuesday, sustaining its 14% gains from the previous day. The meme coin recovers on renewed institutional demand, with inflows of over $900,000 on Monday. Dogecoin must confirm a bullish breakout above a supply zone near $0.10219 to extend its rally.

Institutional risk appetite extends to DOGE

Dogecoin-focused Exchange Traded Funds (ETFs) show early signs of renewed interest in the OG meme coin as the broader cryptocurrency market prepares for the next potential bull cycle. DOGE ETFs recorded $909,650 in inflows on Monday, up from $284,510 on September 15. Positive ETF inflows serve as large demand spikes and typically drive up retail interest, which could support meme coins’ recovery.
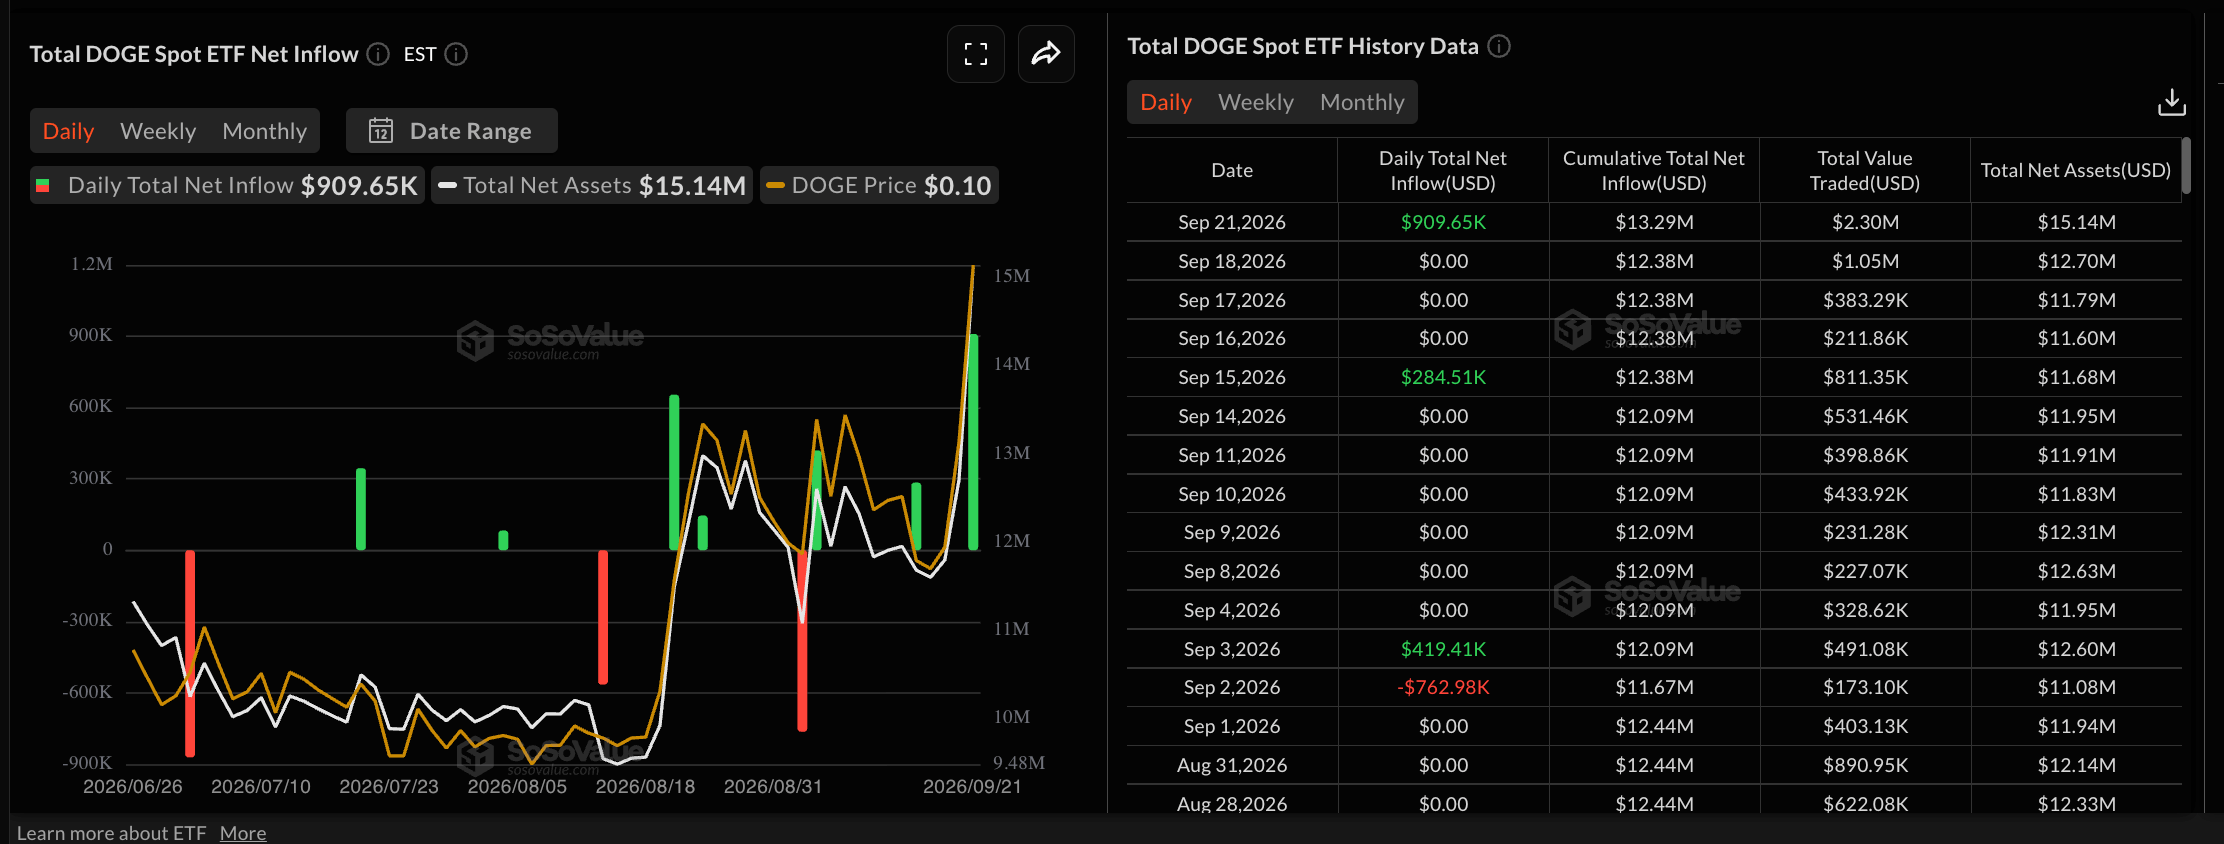
DOGE ETF data. Source: Sosovalue

Technical outlook: DOGE rally could struggle near $0.10

Dogecoin hovers above $0.10000 at press time on Monday, extending its 14% recovery from the previous day. The meme coin rally surpassed a dominant downward resistance trendline at $0.09110, which now acts as underlying support.

Dogecoin also hovers above the 50-day and 100-day Exponential Moving Averages (EMAs), clustered around $0.08365 and $0.08350, respectively, along with the 200-day EMA at $0.09256, reinforcing a constructive near-term bias.

Momentum on the daily chart remains strong, with the Moving Average Convergence Divergence (MACD) crossing above its signal line and the histogram expanding positively, suggesting bullish momentum is building. At the same time, the Relative Strength Index (RSI) at 72 is in overbought territory, suggesting early signs of a stretch.

Looking up, DOGE must confirm the bullish breakout of the supply zone between $0.10000 and $0.10219, which could open the path toward the resistance range between $0.11619 and $0.11732.

On the downside, initial support is seen at the recent breakout zone around the 200-day EMA at $0.09256, closely followed by the reclaimed descending trendline break level at $0.09110. Deeper pullbacks would likely look toward the EMA cluster formed by the 50-day and 100-day EMAs at $0.08365 and $0.08350, respectively, where buyers could attempt to reassert control if profit-taking intensifies.

Chart Analysis DOGE/USDT (Binance)
DOGE/USDT daily price chart.

(The technical analysis of this story was written with the help of an AI tool. Know more.)

Disclaimer: For information purposes only. Past performance is not indicative of future results.
placeholder
Dollar presses 102 as the 10-year yield sits at 5.14% — and October hike odds are only 17%The dollar index closed at 101.99 (+0.20%) on Monday after briefly topping 102.07, while the 10-year Treasury yield rose to 5.14% and the 2-year hit 4.774% — yet futures price only about a 17% chance of a hike at the October 27-28 FOMC, versus roughly 90% for December. The driver is a global bond selloff, not a Fed repricing: France's 10-year OAT jumped to 4.84% ~ 4.94% and the OAT-Bund spread widened to 140 ~ 146bp. Here are the levels, the cross-asset read-through and what to watch.
Author  Irene Q.
Oct 20, Tue
The dollar index closed at 101.99 (+0.20%) on Monday after briefly topping 102.07, while the 10-year Treasury yield rose to 5.14% and the 2-year hit 4.774% — yet futures price only about a 17% chance of a hike at the October 27-28 FOMC, versus roughly 90% for December. The driver is a global bond selloff, not a Fed repricing: France's 10-year OAT jumped to 4.84% ~ 4.94% and the OAT-Bund spread widened to 140 ~ 146bp. Here are the levels, the cross-asset read-through and what to watch.
placeholder
The Fed will sit still on October 28 — but 100 of 100 economists now expect a December hikeA Reuters poll run October 16-20 found 94 of 100 economists expecting the Fed to hold at 3.75-4.00% on October 28 — and all 100 expecting a hike in December, against less than half a month earlier. The market is close to the same price, with CME FedWatch at roughly 17% for October and 82.8% for December. With the Fed in blackout since October 17, here are the five dates that decide the rest of the year, what each one is priced for, and the two directions each can take.
Author  Irene Q.
Oct 22, Thu
A Reuters poll run October 16-20 found 94 of 100 economists expecting the Fed to hold at 3.75-4.00% on October 28 — and all 100 expecting a hike in December, against less than half a month earlier. The market is close to the same price, with CME FedWatch at roughly 17% for October and 82.8% for December. With the Fed in blackout since October 17, here are the five dates that decide the rest of the year, what each one is priced for, and the two directions each can take.
placeholder
Gold Price Analysis Today | Forex Gold Analysis | XAU/USD Analysis - October 23, 2026Get the latest gold price analysis, forex gold insights, and XAU/USD analysis for October 23, 2026. Read on for the details.
Author  Mitrade
Oct 23, Fri
Get the latest gold price analysis, forex gold insights, and XAU/USD analysis for October 23, 2026. Read on for the details.
placeholder
Nasdaq closes at 26,008.86 — 8.9 points above 26,000, and the credit market never blinkedThe Nasdaq Composite fell 2.60% to 26,008.86 on October 22, its worst session since June, as Meta sank 6.98% on 2026 capex guidance of $135–145 billion. But the equal-weight S&P 500 rose 0.73%, high-yield credit was flat and 10-year yields fell 20 basis points. This was an AI de-rating, not a risk-off event — here is the transmission chain, the 29,000 / 28,200 levels and what would prove it wrong.
Author  Irene Q.
Oct 23, Fri
The Nasdaq Composite fell 2.60% to 26,008.86 on October 22, its worst session since June, as Meta sank 6.98% on 2026 capex guidance of $135–145 billion. But the equal-weight S&P 500 rose 0.73%, high-yield credit was flat and 10-year yields fell 20 basis points. This was an AI de-rating, not a risk-off event — here is the transmission chain, the 29,000 / 28,200 levels and what would prove it wrong.
placeholder
Brent tops $113 on Saudi supply risk — but the diesel line in the EIA report is the tellBrent's December contract settled at $113.17 on October 22, up 4.00% and the highest close since May 4, after Saudi Arabia restricted refined-product shipments. The same session's EIA report showed crude stocks down 3.06 million barrels and gasoline down 2.95 million — but distillates built 1.68 million. That single line decides whether $113 holds: here are the data, the 108.8 / 114.0 / 119.3 levels and the two scenarios.
Author  Irene Q.
Oct 23, Fri
Brent's December contract settled at $113.17 on October 22, up 4.00% and the highest close since May 4, after Saudi Arabia restricted refined-product shipments. The same session's EIA report showed crude stocks down 3.06 million barrels and gasoline down 2.95 million — but distillates built 1.68 million. That single line decides whether $113 holds: here are the data, the 108.8 / 114.0 / 119.3 levels and the two scenarios.
Related Instrument
goTop
quote