

Dogecoin Price Forecast: DOGE sell-off seems unstoppable despite renewed retail interest

Source Fxstreet
  • Dogecoin falls for a fourth consecutive daily session, trading below $0.0700 on Thursday.
  • The DOGE derivatives market experiences renewed retail demand as Open Interest climbs to 16.36 billion DOGE.
  • Dogecoin’s technical picture remains largely bearish as defined by the overhead dynamic SuperTrend indicator.

Dogecoin (DOGE) is trading under dominant selling pressure on Thursday, hovering below $0.0700, a recent support-turned-resistance level. The meme coin has shed 3% of its value in the first week of August, against a backdrop of heavier selling pressure in previous months since May highs around $0.1186.

Dogecoin attracts renewed retail capital

The Dogecoin derivatives market has experienced a massive uptick in perpetual futures Open Interest (OI) to 16.36 billion DOGE on Thursday, from 15.45 billion DOGE the previous day. OI reflects the notional value of outstanding futures contracts and options. A sustained uptick in OI can provide price stability and support a potential recovery.
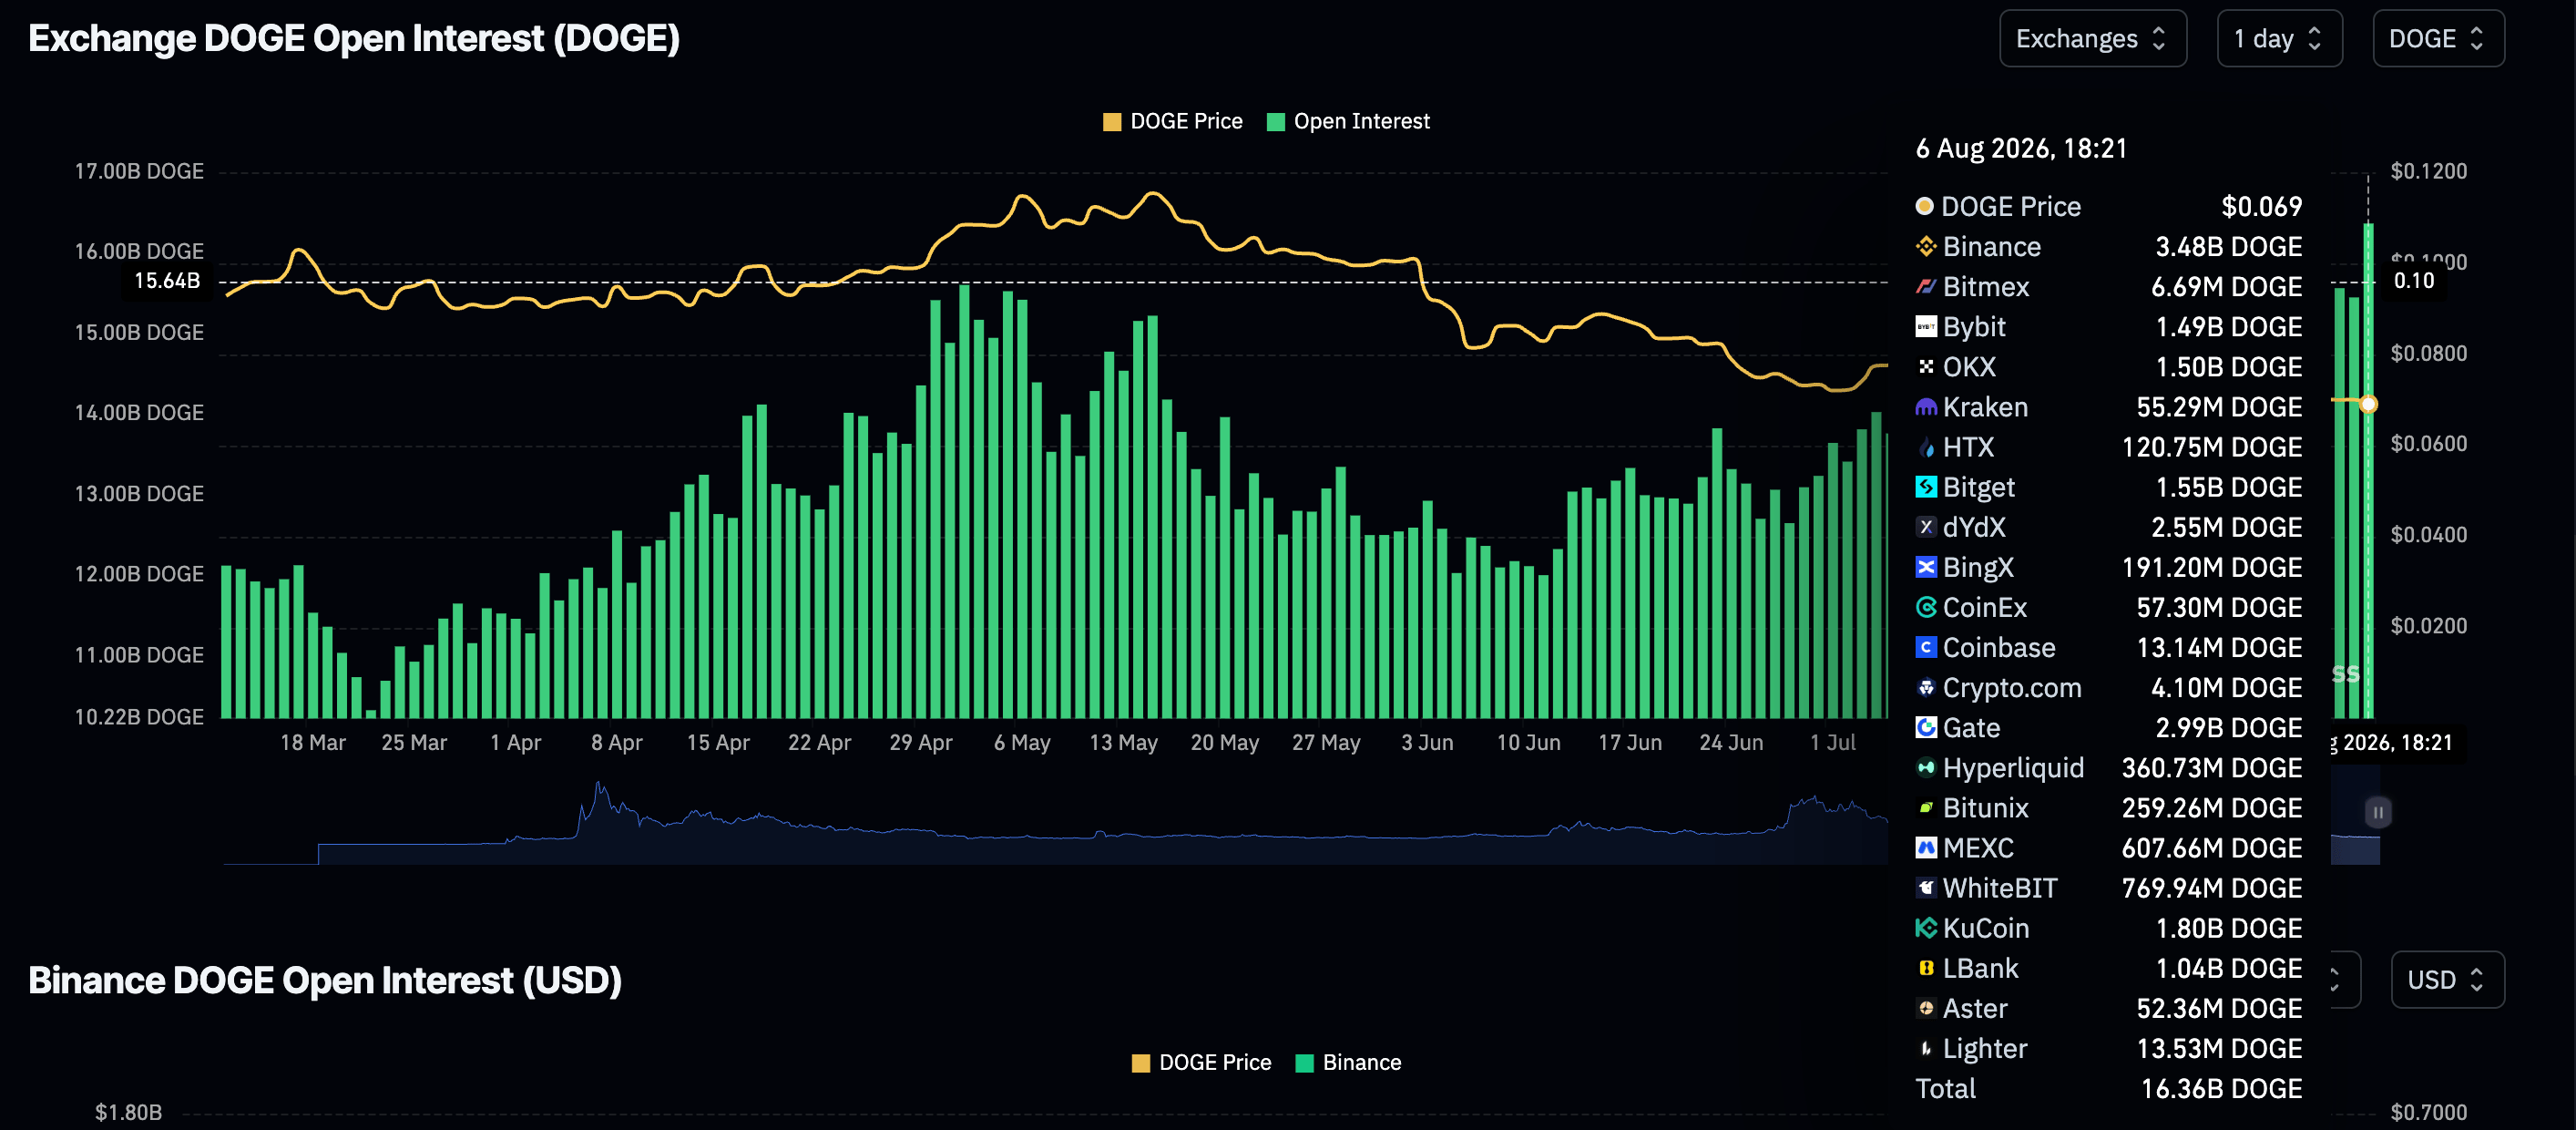
XRP Futures OI | Source: CoinGlass


Technical analysis: Dogecoin sellers gain ground

Dogecoin trades at $0.0691, keeping a bearish near-term bias as the price holds below the 50-day Exponential Moving Average (EMA) at $0.0754, the 100-day EMA at $0.0830 and the 200-day EMA at $0.0986. The SuperTrend line at $0.0758 reinforces this overhead supply, while the Relative Strength Index (RSI) near 39 suggests weak demand.

At the same time, the Moving Average Convergence Divergence (MACD) stays marginally positive, hinting at only tentative downside momentum rather than a strong recovery.
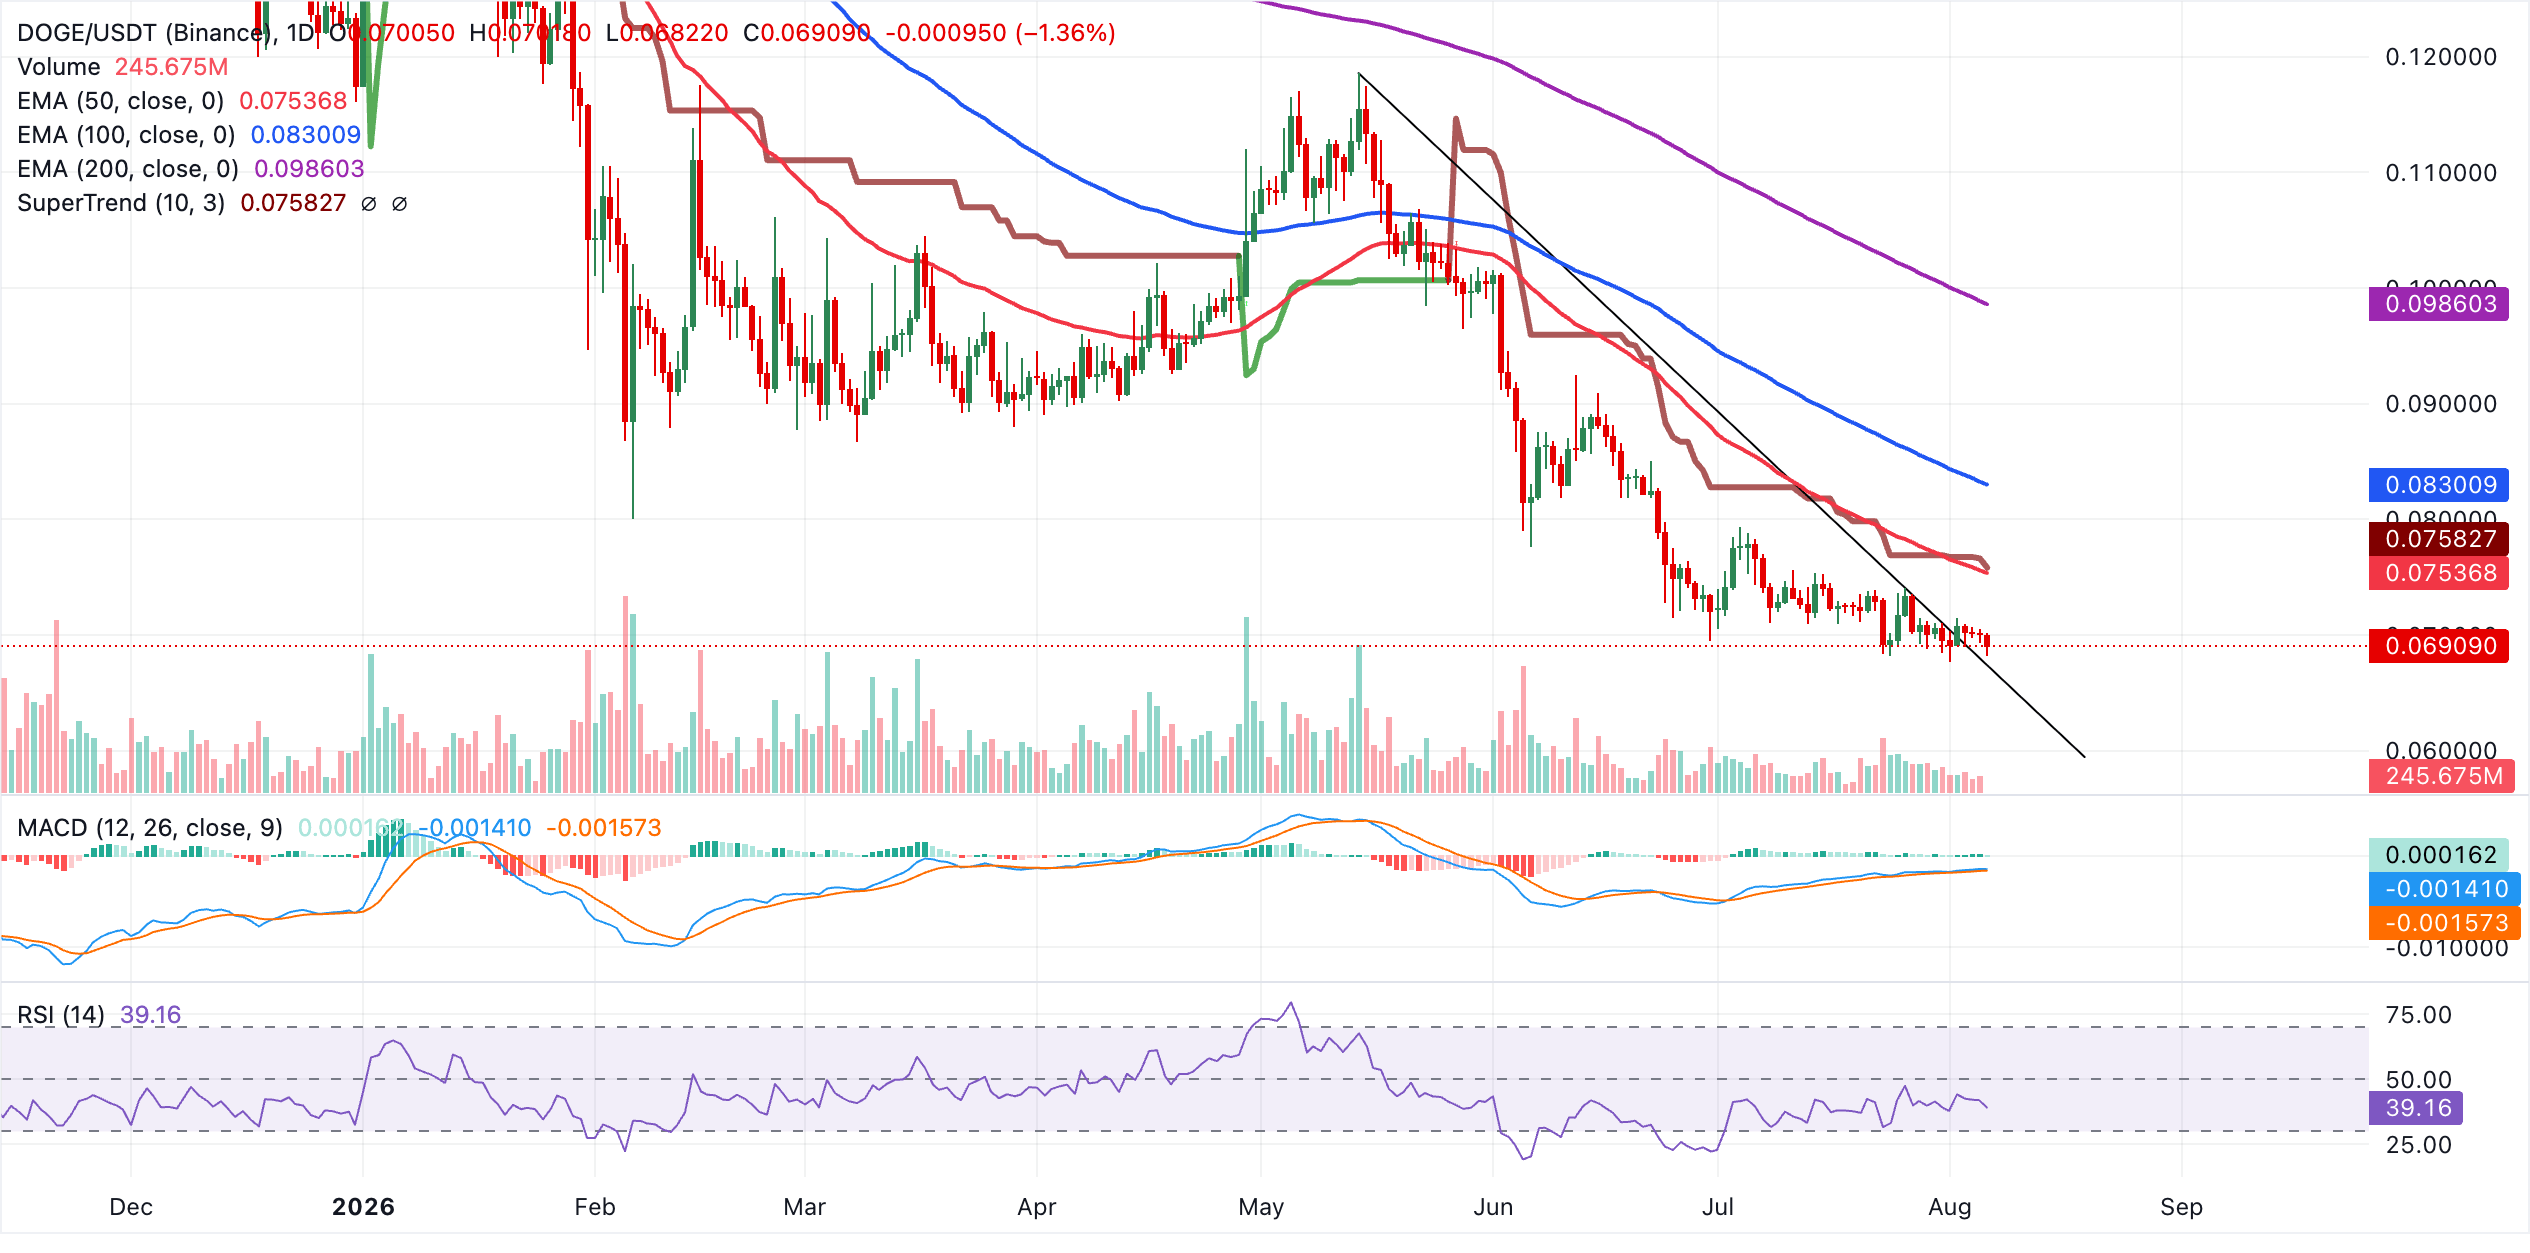
DOGE/USDT daily chart

Initial resistance appears at the 50-day EMA around $0.0754, closely followed by the SuperTrend barrier at $0.0758. A daily close above this cluster would be needed to ease immediate bearish pressure and expose the 100-day EMA at $0.0830, ahead of the more distant 200-day EMA near $0.0986.
On the downside, the prior downward trendline break level at $0.0670 acts as the first meaningful support. A sustained move below this floor would likely extend the current decline, while holding above it keeps DOGE consolidating within a depressed but still contained range.

(The technical analysis of this story was written with the help of an AI tool. Know more.)

Open Interest, funding rate FAQs

Higher Open Interest is associated with higher liquidity and new capital inflow to the market. This is considered the equivalent of increase in efficiency and the ongoing trend continues. When Open Interest decreases, it is considered a sign of liquidation in the market, investors are leaving and the overall demand for an asset is on a decline, fueling a bearish sentiment among investors.

Funding fees bridge the difference between spot prices and prices of futures contracts of an asset by increasing liquidation risks faced by traders. A consistently high and positive funding rate implies there is a bullish sentiment among market participants and there is an expectation of a price hike. A consistently negative funding rate for an asset implies a bearish sentiment, indicating that traders expect the cryptocurrency’s price to fall and a bearish trend reversal is likely to occur.

Disclaimer: For information purposes only. Past performance is not indicative of future results.
placeholder
Dollar presses 102 as the 10-year yield sits at 5.14% — and October hike odds are only 17%The dollar index closed at 101.99 (+0.20%) on Monday after briefly topping 102.07, while the 10-year Treasury yield rose to 5.14% and the 2-year hit 4.774% — yet futures price only about a 17% chance of a hike at the October 27-28 FOMC, versus roughly 90% for December. The driver is a global bond selloff, not a Fed repricing: France's 10-year OAT jumped to 4.84% ~ 4.94% and the OAT-Bund spread widened to 140 ~ 146bp. Here are the levels, the cross-asset read-through and what to watch.
Author  Irene Q.
Oct 20, Tue
The dollar index closed at 101.99 (+0.20%) on Monday after briefly topping 102.07, while the 10-year Treasury yield rose to 5.14% and the 2-year hit 4.774% — yet futures price only about a 17% chance of a hike at the October 27-28 FOMC, versus roughly 90% for December. The driver is a global bond selloff, not a Fed repricing: France's 10-year OAT jumped to 4.84% ~ 4.94% and the OAT-Bund spread widened to 140 ~ 146bp. Here are the levels, the cross-asset read-through and what to watch.
placeholder
The Fed will sit still on October 28 — but 100 of 100 economists now expect a December hikeA Reuters poll run October 16-20 found 94 of 100 economists expecting the Fed to hold at 3.75-4.00% on October 28 — and all 100 expecting a hike in December, against less than half a month earlier. The market is close to the same price, with CME FedWatch at roughly 17% for October and 82.8% for December. With the Fed in blackout since October 17, here are the five dates that decide the rest of the year, what each one is priced for, and the two directions each can take.
Author  Irene Q.
Oct 22, Thu
A Reuters poll run October 16-20 found 94 of 100 economists expecting the Fed to hold at 3.75-4.00% on October 28 — and all 100 expecting a hike in December, against less than half a month earlier. The market is close to the same price, with CME FedWatch at roughly 17% for October and 82.8% for December. With the Fed in blackout since October 17, here are the five dates that decide the rest of the year, what each one is priced for, and the two directions each can take.
placeholder
Gold Price Analysis Today | Forex Gold Analysis | XAU/USD Analysis - October 23, 2026Get the latest gold price analysis, forex gold insights, and XAU/USD analysis for October 23, 2026. Read on for the details.
Author  Mitrade
Oct 23, Fri
Get the latest gold price analysis, forex gold insights, and XAU/USD analysis for October 23, 2026. Read on for the details.
placeholder
Nasdaq closes at 26,008.86 — 8.9 points above 26,000, and the credit market never blinkedThe Nasdaq Composite fell 2.60% to 26,008.86 on October 22, its worst session since June, as Meta sank 6.98% on 2026 capex guidance of $135–145 billion. But the equal-weight S&P 500 rose 0.73%, high-yield credit was flat and 10-year yields fell 20 basis points. This was an AI de-rating, not a risk-off event — here is the transmission chain, the 29,000 / 28,200 levels and what would prove it wrong.
Author  Irene Q.
Oct 23, Fri
The Nasdaq Composite fell 2.60% to 26,008.86 on October 22, its worst session since June, as Meta sank 6.98% on 2026 capex guidance of $135–145 billion. But the equal-weight S&P 500 rose 0.73%, high-yield credit was flat and 10-year yields fell 20 basis points. This was an AI de-rating, not a risk-off event — here is the transmission chain, the 29,000 / 28,200 levels and what would prove it wrong.
placeholder
Brent tops $113 on Saudi supply risk — but the diesel line in the EIA report is the tellBrent's December contract settled at $113.17 on October 22, up 4.00% and the highest close since May 4, after Saudi Arabia restricted refined-product shipments. The same session's EIA report showed crude stocks down 3.06 million barrels and gasoline down 2.95 million — but distillates built 1.68 million. That single line decides whether $113 holds: here are the data, the 108.8 / 114.0 / 119.3 levels and the two scenarios.
Author  Irene Q.
Oct 23, Fri
Brent's December contract settled at $113.17 on October 22, up 4.00% and the highest close since May 4, after Saudi Arabia restricted refined-product shipments. The same session's EIA report showed crude stocks down 3.06 million barrels and gasoline down 2.95 million — but distillates built 1.68 million. That single line decides whether $113 holds: here are the data, the 108.8 / 114.0 / 119.3 levels and the two scenarios.
Related Instrument
goTop
quote