

Ethereum Price Forecast: ETH ends six-month loss streak with 7% gain in March, is the bottom in?
Ethereum price today: $2,130
- Ethereum ended a six-month negative streak after recording a 7% gain in March.
- BitMine Chairman Thomas Lee noted that the global market sell-off is 90-95% likely over.
- ETH is tackling the 50-day EMA after flipping the $2,108 resistance.
Ethereum (ETH) is up more than 1% over the past 24 hours as of writing on Wednesday, beginning the new month on a positive note.
The move comes after ETH ended a six-month loss streak, posting an average gain of roughly 7% in March despite the US-Israel war with Iran pressuring financial markets throughout the month. The top altcoin recorded losses from September to February.
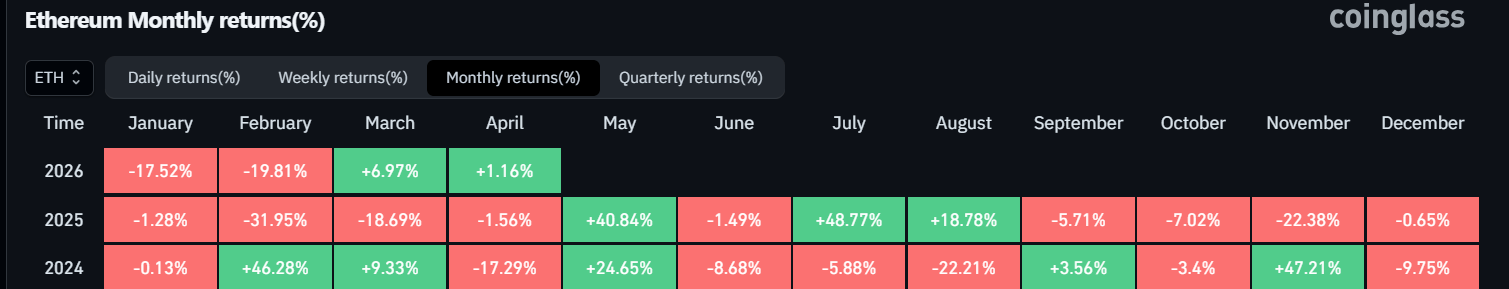
In contrast, top equity indices and commodities ended the month in negative territory.
In March, ETH accumulation addresses — wallets with no record of selling activity — were largely busy, scooping about 2.7 million ETH, representing their largest monthly increase in over a year.
-1775069251495-1775069251497.png)
Ethereum treasury firm BitMine Immersion Technologies (BMNR) has been a major catalyst behind that increase. The firm has been purchasing ETH consistently amid weak prices, even as its Chairman, Thomas Lee, continues to outline predictions for the end of the recent crypto winter.
In a remark on CNBC's Closing Bell on Monday, Lee said he would be buying the market at current prices, noting that the sell-off is 90-95% over. Lee had previously predicted that ETH would post a positive return and eventually bottom in March.
However, critics argued that the BitMine chairman has been giving consistent bullish predictions over the past few months. Hence, being right on this occasion may not indicate accuracy.
BitMine holds the largest corporate Ethereum treasury, worth 4.73 million ETH, of which 3.14 million has been deployed to staking contracts.
Ethereum Price Forecast: ETH tackles 50-day EMA
Ethereum recorded $57.4 million in liquidations over the past 24 hours, led by $41.16 million in liquidated short positions, according to Coinglass data.
In the daily chart, ETH trades at $2,130. The near-term bias is mildly bullish as price holds above the 20-day Exponential Moving Average (EMA) near $2,085 while stabilizing after the recent pullback. The 50-day EMA around $2,160 caps the immediate upside and defines the boundary of a developing recovery phase beneath the still-declining 100-day EMA near $2,400.
The Relative Strength Index (RSI) at 54 leans to the buy side without overextension, while the Stochastic Oscillator's (Stoch) rebound from oversold territory signals improving upside momentum after last week's dip.
Immediate resistance is at $2,388, where horizontal supply converges with the broader EMA cluster overhead. A daily close above this level would open the way toward $2,746 first, then $3,412.
On the downside, initial support stands at $2,108, guarding the 20-day EMA area and the recent swing region, with a break lower exposing $1,911 and then $1,741 as the next key floor. Deeper weakness would then target $1,524, ahead of major support at $1,405, where buyers would be expected to defend the broader bullish structure.
(The technical analysis of this story was written with the help of an AI tool.)
Recommended Articles


