

WTI Price Forecast: Bias stays lower with RSI below 50 and key SMAs overhead
- WTI attempts a modest rebound, snapping a three-day losing streak after hitting near one-month lows around $57.33.
- Revived December Fed rate-cut expectations help stabilize prices, while Russia–Ukraine peace-talk developments keep sentiment cautious.
- Technically, WTI stays confined within a downward channel, while RSI remains below 50, keeping the bias tilted lower.
West Texas Intermediate (WTI) Crude Oil is attempting a modest rebound on Monday, snapping a three-day losing streak as traders balance revived December Federal Reserve (Fed) interest rate cut expectations with ongoing Russia–Ukraine peace-talk developments. At the time of writing, WTI is trading around $58.40, recovering from near one-month lows around $57.33.
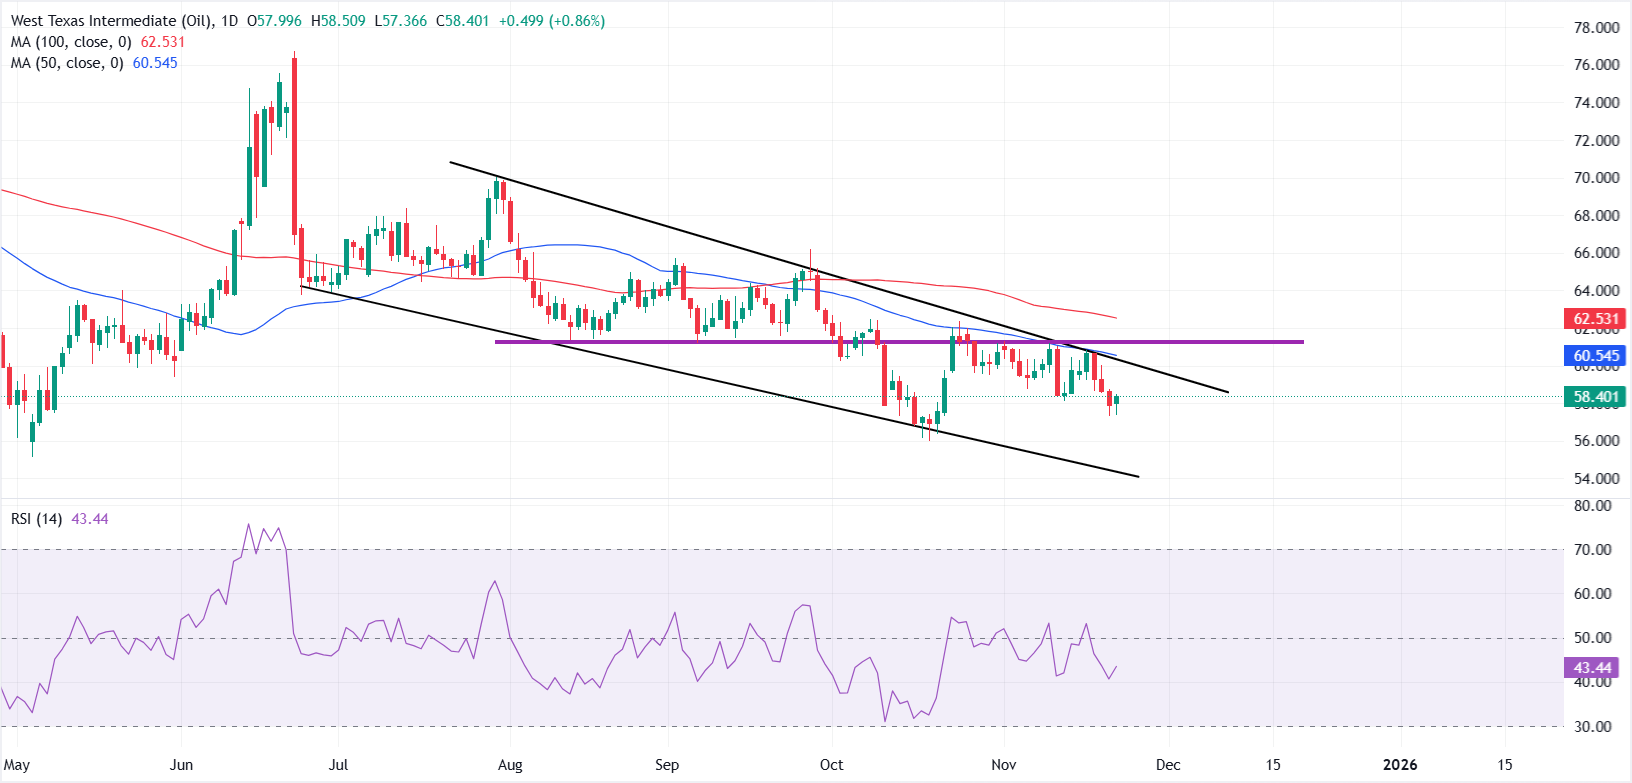
From a technical point of view, WTI remains confined within a well-defined downward parallel channel on the daily chart, characterized by a sequence of lower highs and lower lows, keeping the broader outlook tilted to the downside. Prices continue to trade below both the 50-day and 100-day Simple Moving Averages (SMAs), reinforcing a bearish structural bias.
On the upside, $59.00 could act as the initial resistance before WTI retests the upper boundary of the channel near $60.50. The $60.50-$61.50 region marks a strong confluence barrier, where repeated attempts to break higher have failed since late October.
This zone also aligns with the 50-day SMA around $60.54 and previous support turned resistance, adding to the headwinds. Unless this area is cleared decisively, momentum is likely to remain in favour of sellers. A firm breakout would expose the 100-day SMA next, followed by the September swing high near $66.19.
On the downside, the fresh one-month low at $57.33 offers immediate support, with the October swing low around $56.00 as the next level to watch in case of further weakness.
The Relative Strength Index (RSI 14) is holding below the 50 midline, currently around 43, indicating subdued momentum and a lack of firm bullish conviction at this stage.
WTI Oil FAQs
WTI Oil is a type of Crude Oil sold on international markets. The WTI stands for West Texas Intermediate, one of three major types including Brent and Dubai Crude. WTI is also referred to as “light” and “sweet” because of its relatively low gravity and sulfur content respectively. It is considered a high quality Oil that is easily refined. It is sourced in the United States and distributed via the Cushing hub, which is considered “The Pipeline Crossroads of the World”. It is a benchmark for the Oil market and WTI price is frequently quoted in the media.
Like all assets, supply and demand are the key drivers of WTI Oil price. As such, global growth can be a driver of increased demand and vice versa for weak global growth. Political instability, wars, and sanctions can disrupt supply and impact prices. The decisions of OPEC, a group of major Oil-producing countries, is another key driver of price. The value of the US Dollar influences the price of WTI Crude Oil, since Oil is predominantly traded in US Dollars, thus a weaker US Dollar can make Oil more affordable and vice versa.
The weekly Oil inventory reports published by the American Petroleum Institute (API) and the Energy Information Agency (EIA) impact the price of WTI Oil. Changes in inventories reflect fluctuating supply and demand. If the data shows a drop in inventories it can indicate increased demand, pushing up Oil price. Higher inventories can reflect increased supply, pushing down prices. API’s report is published every Tuesday and EIA’s the day after. Their results are usually similar, falling within 1% of each other 75% of the time. The EIA data is considered more reliable, since it is a government agency.
OPEC (Organization of the Petroleum Exporting Countries) is a group of 12 Oil-producing nations who collectively decide production quotas for member countries at twice-yearly meetings. Their decisions often impact WTI Oil prices. When OPEC decides to lower quotas, it can tighten supply, pushing up Oil prices. When OPEC increases production, it has the opposite effect. OPEC+ refers to an expanded group that includes ten extra non-OPEC members, the most notable of which is Russia.
Recommended Articles


