

Top 3 Price Prediction: Bitcoin, Ethereum, Ripple – BTC, ETH and XRP Attempt Recovery Post-Selloff

- Gold Prices Under Pressure After Hitting $4,600, UBS: Safe-Haven Logic Unchanged But Only Delayed.
- US-Iran Rift Persists, Will Gold Rise or Fall Next?
- Gold rallies on hopes for US-Iran talks and falling US Treasury yields
- Gold Price Forecast: XAU/USD opens lower around $4,450 on fears of widening Iran conflicts
- USD/JPY Hits 160.00 Mark, Will Japanese Government Intervene? Will the Currency’s Rally Be Contained?
- Seesaw Effect Continues. US Pre-Market Three Major Index Futures Weaken, Oil Prices Rise, Bitcoin Drops Below 68,000 Mark

Bitcoin reclaims $87,700 following a sharp 20% plunge to $80,600, with the $90,000 psychological barrier now looming as the primary resistance.
Ethereum defends a critical support cluster near $2,749, though downside risks persist as long as price action remains below key overhead levels.
XRP stabilizes above $2.08 after successfully testing the $1.96 floor, signaling that the most intense phase of the liquidation cascade may be subsiding.
Major crypto assets Bitcoin (BTC), Ethereum (ETH), and Ripple (XRP) are attempting to stabilize on Monday, finding footing after a brutal market flush. All three majors are currently holding above immediate support zones, offering traders a tentative justification to eye a bounce rather than fear a straight-line collapse. However, sentiment remains precarious; any relief rally faces the threat of overhead supply from participants left trapped during last week’s correction.
Bitcoin stabilizes after massive correction
Bitcoin’s price action over the last fortnight has been unforgiving. Following a rejection at the $106,453 peak on November 11, BTC shed over 20% in just 12 days, ultimately bottoming out at $80,600 last Friday. Weekend trading offered a reprieve as buyers stepped back in, forcing a Sunday close above $86,830. As of Monday, BTC continues to grind higher, changing hands above $87,700.
For short-term speculators, the critical question is whether this move represents a "dead-cat bounce" or genuine accumulation. If upside momentum sustains, the chart points to $90,000 as the next logical battlefield. This round number, formerly a support level, now serves as a litmus test for buyer conviction. Reclaiming this zone wouldn't entirely erase the 20% drawdown, but it would disrupt the narrative that every rally is merely an opportunity to sell.
Technically, the momentum is becoming less one-sided. The daily Relative Strength Index (RSI) sits at 30, recovering from a brief dip below the traditional oversold threshold last week. This suggests that aggressive selling pressure is exhausting itself as bears run out of ammunition and profit-taking commences. While oversold readings do not guarantee a trend reversal, they often coincide with local bottoms.
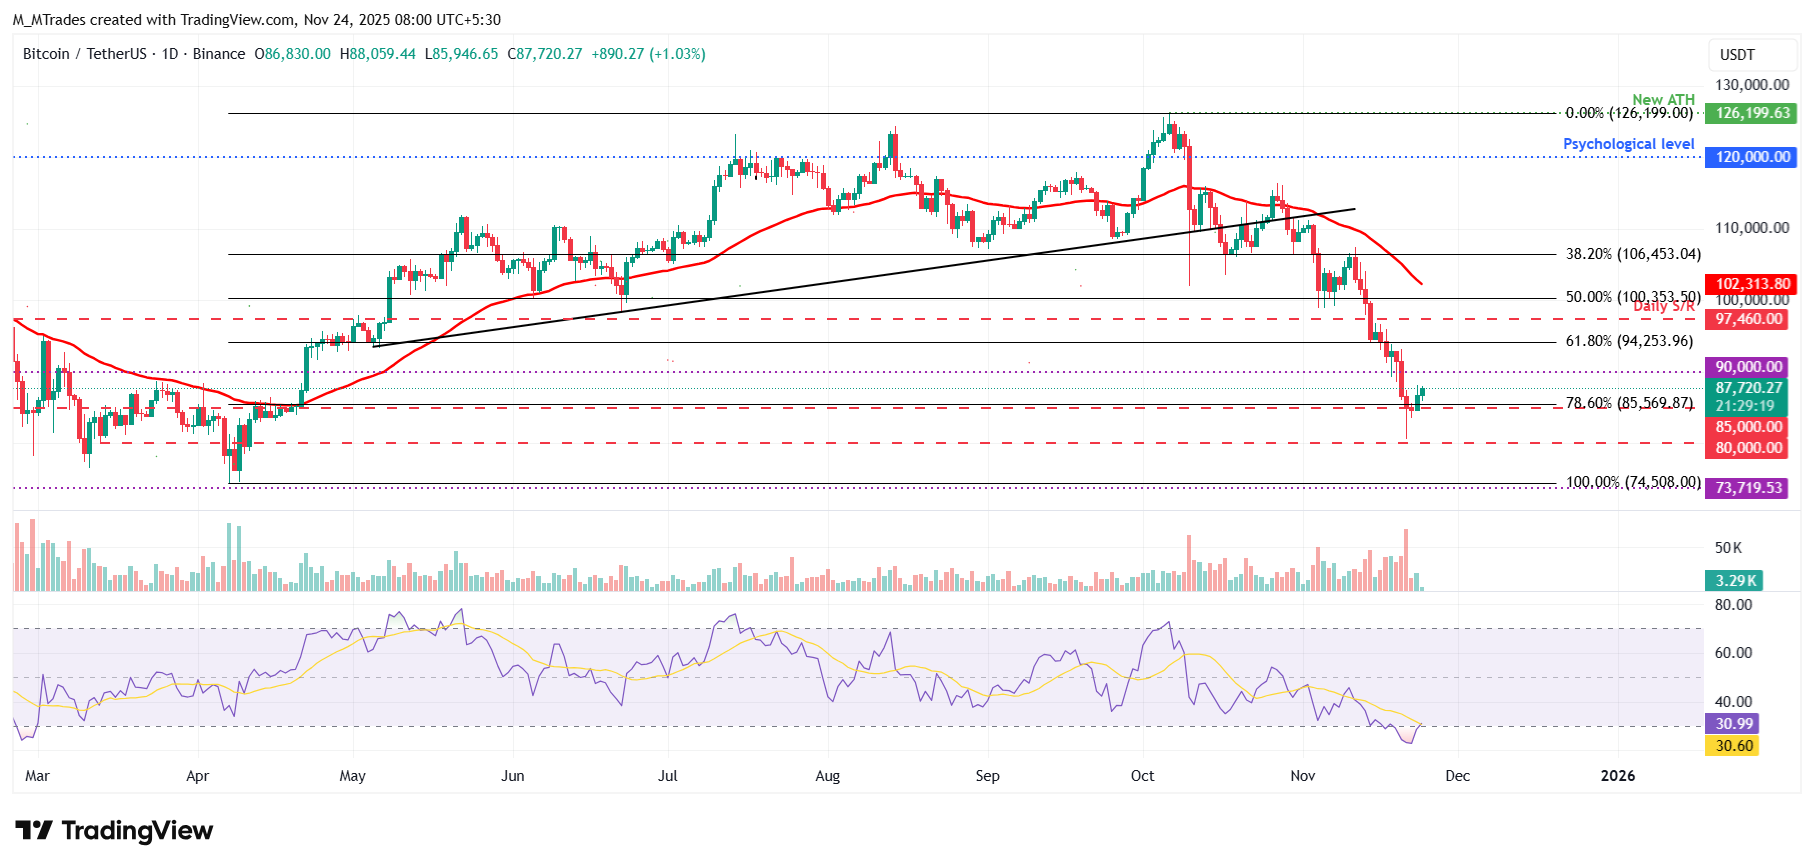
BTC/USDT daily chart
Conversely, should the market falter, the roadmap turns bearish. A renewed correction dragging BTC lower would place the spotlight squarely on the $80,000 psychological anchor. A retest—or a decisive break—of that level would force medium-term holders to determine if this is a healthy pullback within a super-cycle or the beginning of a significant regime shift.
Ethereum rebounds after retesting key support zone
In percentage terms, Ethereum’s descent has been steeper. After hitting a wall at a broken trendline on November 13, ETH tumbled more than 18% over the subsequent eight days, tagging a low of $2,623 on Friday. Crucially, the market drew a line in the sand over the weekend: price bounced precisely from the 61.8% Fibonacci retracement level at $2,749—a zone heavily watched by swing traders for deep but standard corrections.
This defense has granted ETH necessary breathing room. Trading above $2,840 on Monday, the asset has put some distance between itself and last week’s lows. As long as the $2,749–$2,800 floor holds on a closing basis, the path of least resistance favors a retest of daily resistance near $3,017. This level, having previously broken to the downside, will be the decision point determining if this bounce is simple mean reversion or the start of a structural reset.
Like Bitcoin, Ethereum’s RSI is climbing out of oversold territory. This shift implies that the cascade of forced liquidations is fading, giving way to more balanced, two-sided trading. While not yet a confirmation of a new uptrend, it signals that the extreme fear driving the market is subsiding.
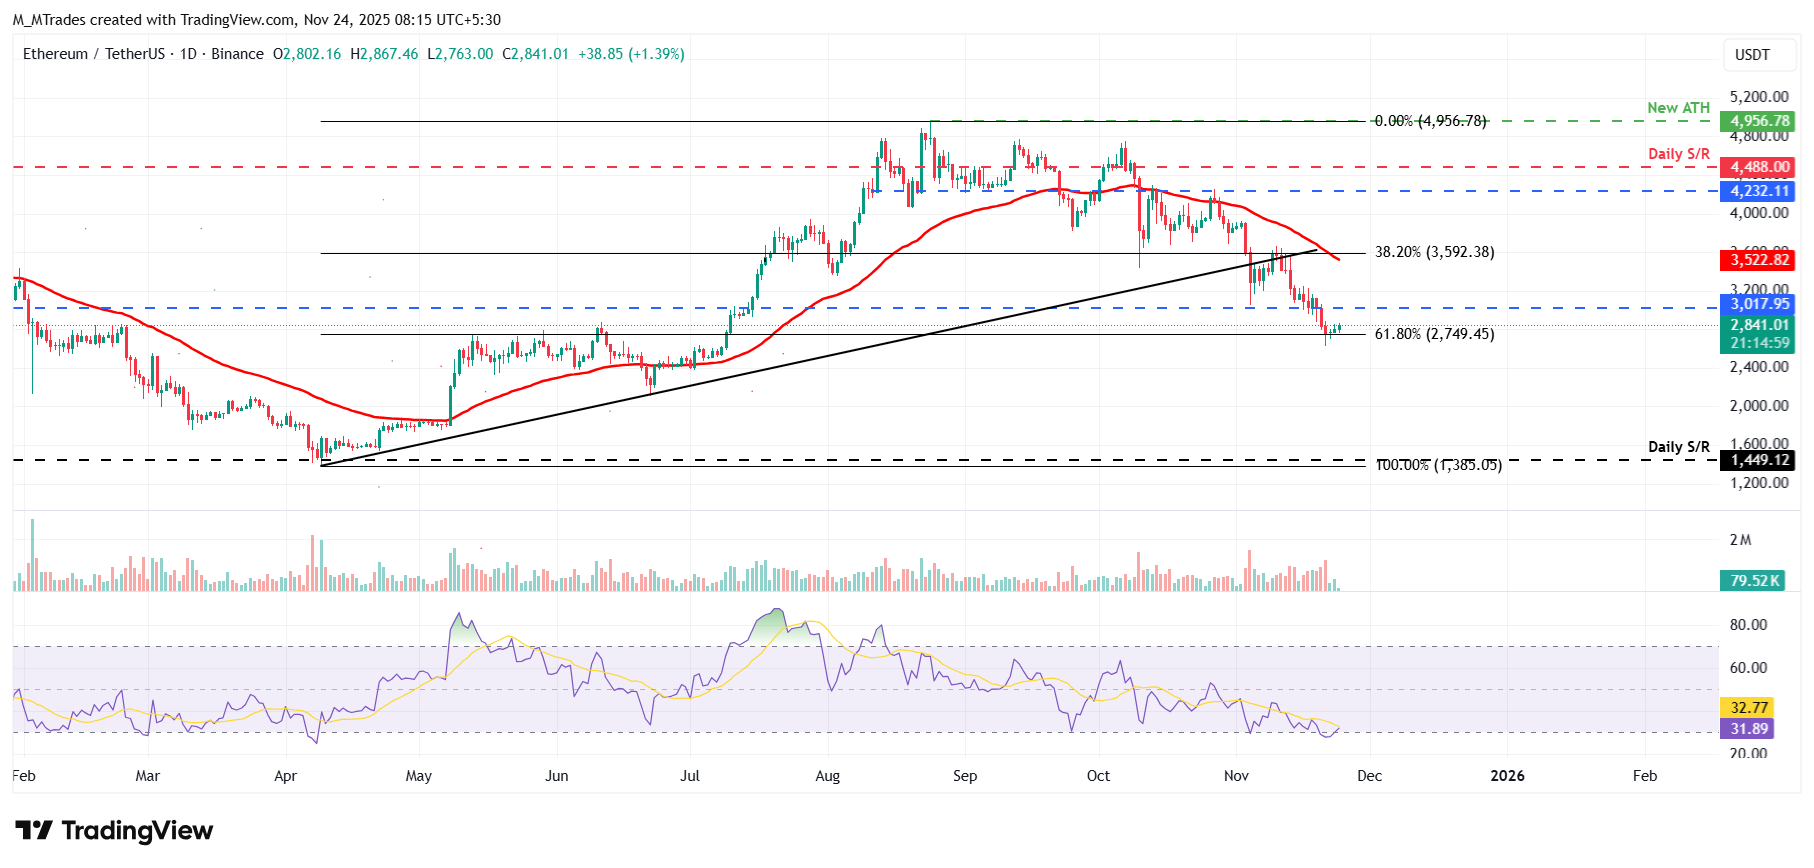
ETH/USDT daily chart
However, if ETH fails to maintain this footing, the $2,749 level returns as the primary line of defense. A sustained violation of this support would revive the risk of a deeper extension, serving as a harsh reminder that in volatile environments, broken supports often flip into formidable resistance.
XRP recovers after finding support at the $1.96 level
Among the top three, XRP has endured significant turbulence. The token faced rejection at the 50-day exponential moving average (EMA) of $2.38 on November 13, sliding nearly 19% over the next eight days to print a low of $1.82 on Friday. However, a weekend retest of daily support near $1.96 held firm, setting the stage for the current rotation higher.
By Monday, XRP is trading above $2.08, indicating that sellers are stepping aside following the sharp drop. If the recovery effort persists, the primary upside target is the next daily resistance band around $2.35. Situated just below the 50-day EMA, a move to this level would mark a meaningful retracement, testing the resolve of sidelined sellers looking to fade the rally.
The RSI currently reads 41, having rebounded from oversold conditions. This reading points to easing bearish pressure; the market has exited "capitulation mode," even if it hasn't flipped to outright bullishness. In this neutral zone, price action is often driven less by news and more by positioning—specifically, who is overextended and who is willing to accumulate on weakness.
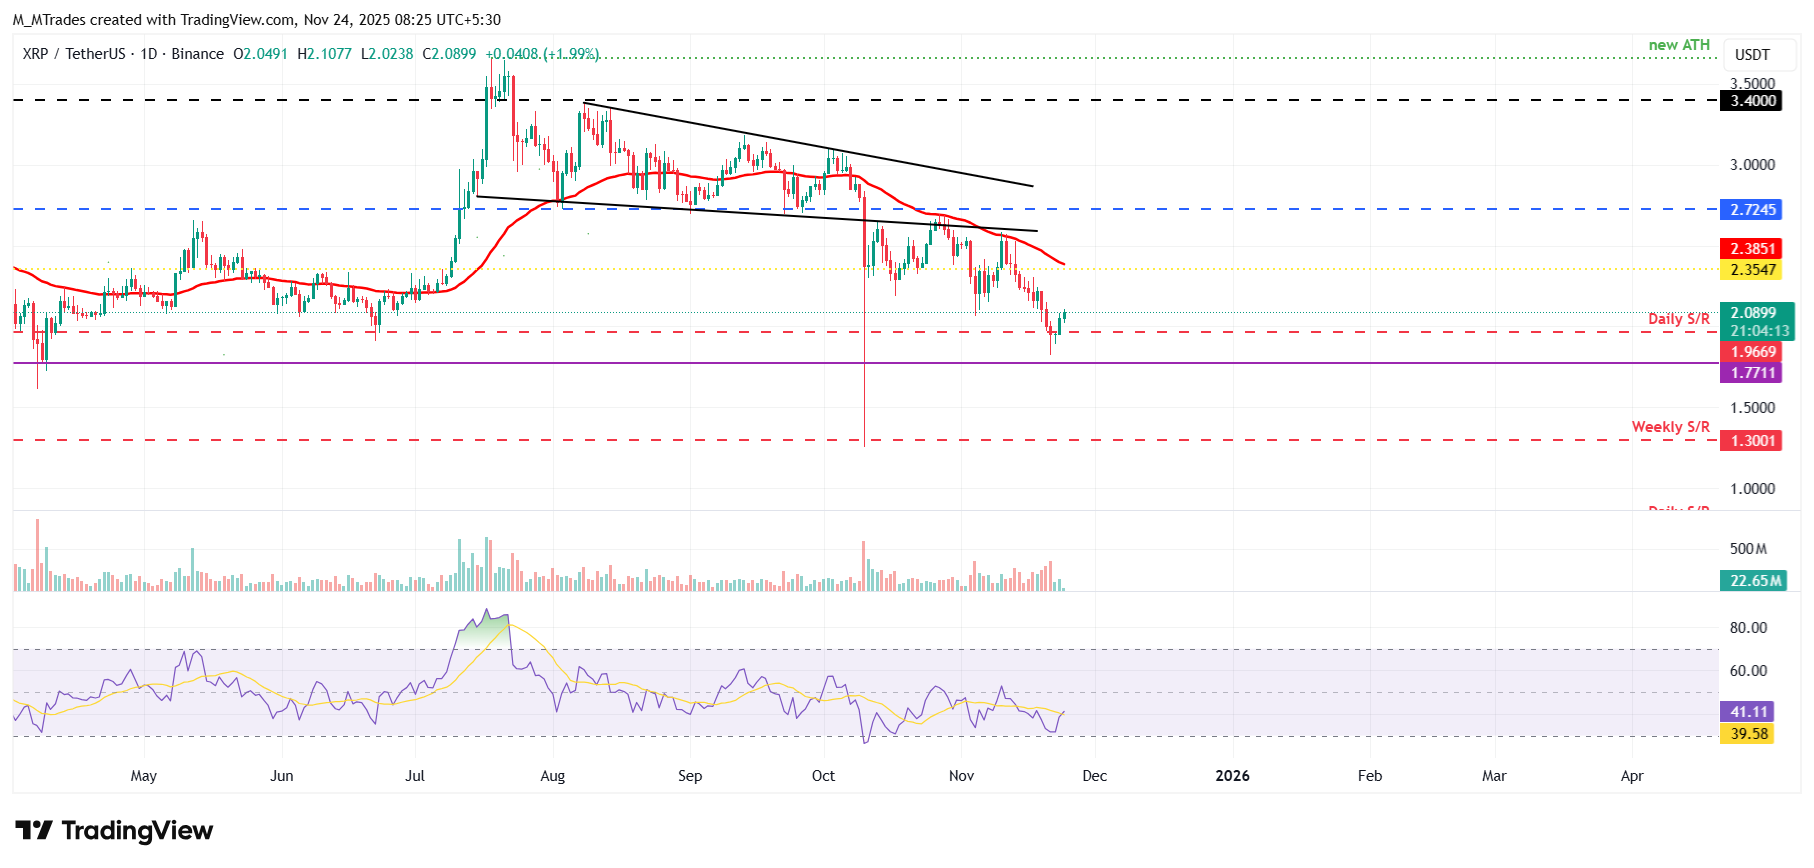
XRP/USDT daily chart
Should XRP’s bounce stall and the token roll over, traders will immediately refocus on the Friday low of $1.82. A return to that area—and particularly a breakdown below it—would invalidate the recent stabilization, suggesting that the defense of $1.96 was merely a pause in an unfinished downtrend.
Read more
The above content was completed with the assistance of AI and has been reviewed by an editor.


