

Bitcoin Weekly Forecast: BTC drops to seven-month lows as selling pressure intensifies
- Bitcoin extends losses on Friday, reaching levels not seen since mid-April.
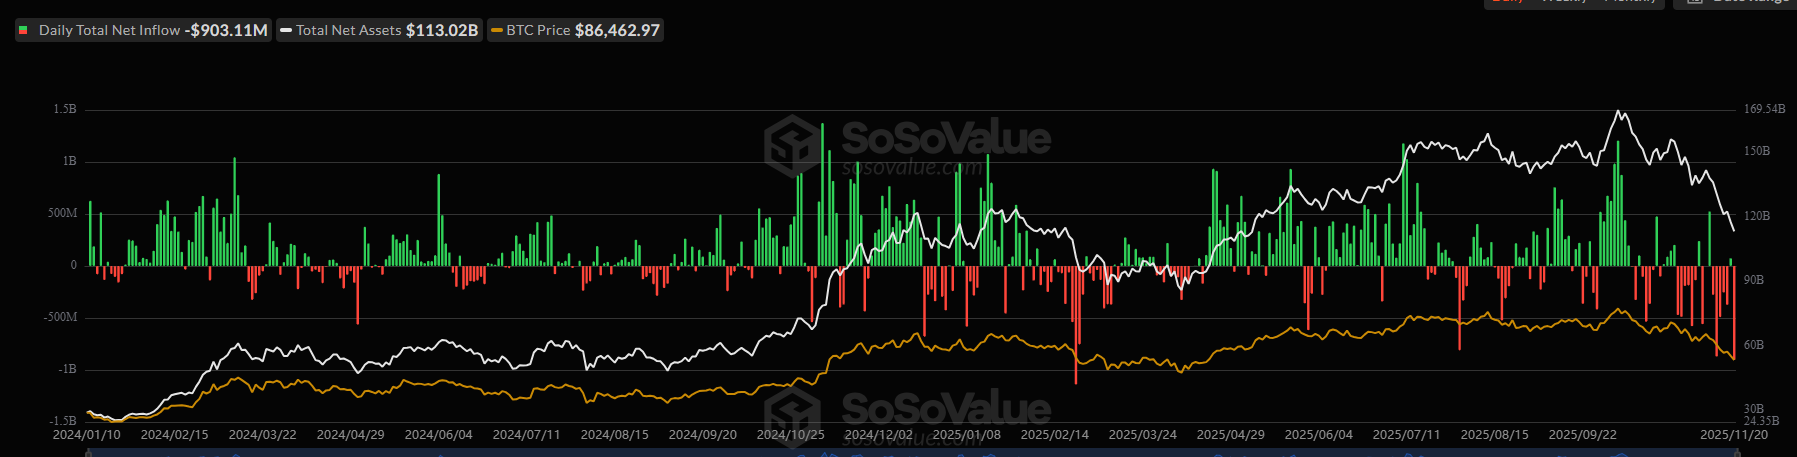
- US-listed spot ETFs record a weekly outflow of $1.45 billion until Thursday, making a fourth consecutive week of investor withdrawals.
- On-chain metrics warn of sustained bearish conditions as selling pressure continues to dominate.
Bitcoin (BTC) price continues its downward slide, trading near $82,000 at the time of writing on Friday and plunging to seven-month lows as bearish sentiment tightens its grip on the crypto market. Institutional demand continues to weaken as spot Bitcoin Exchange Traded Funds (ETFs) recorded a weekly outflow of $1.45 billion as of Thursday, marking a fourth consecutive week of withdrawals. Adding to this, deteriorating on-chain conditions signal that traders may not yet have seen a definitive bottom, as the largest cryptocurrency by market capitalization remains vulnerable to further downside in the days ahead.
Liquidations mount as Bitcoin slides to multi-month lows
Bitcoin continues its correction for a fourth consecutive week, reaching a low near $81,600 at the time of writing on Friday, nearly 35% below its record high of $126,199 set in October.
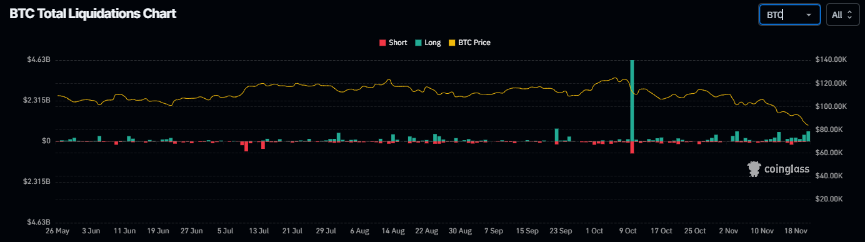
BTC price pullback this week has triggered a wave of liquidations for BTC traders, totaling $1.82 billion, of which $1.50 billion were long positions, according to Coinglass' chart.
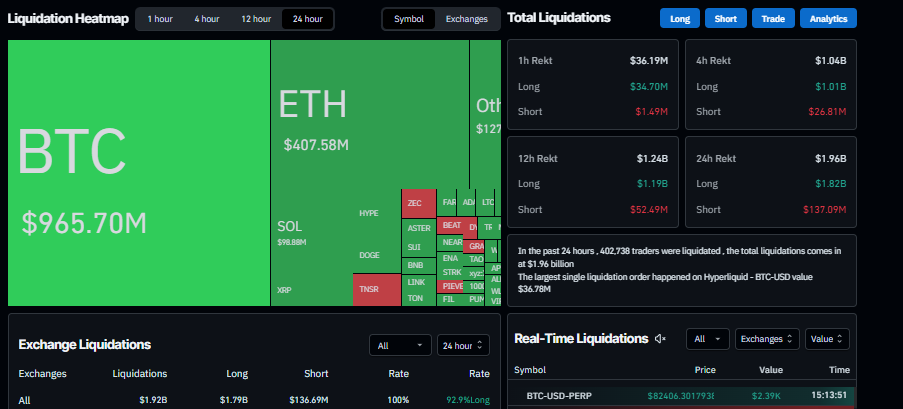
Over the past 24 hours, 402,738 traders were liquidated, totaling more than $1.96 billion in liquidations. Over 92% of these positions were long bets, highlighting traders’ overly bullish positioning, while the largest single liquidation occurred on Hyperliquid – BTC/USD valued at $36.78 million.
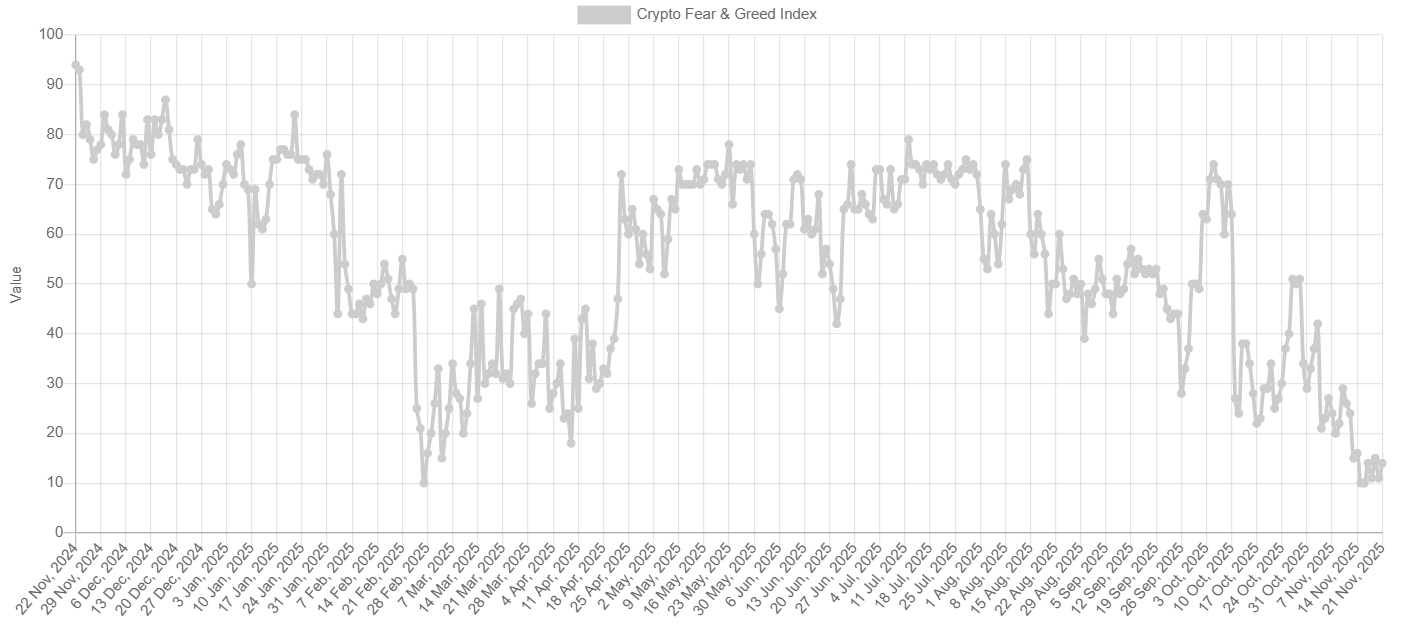
The Fear and Greed Index falls to 14 on Friday, nearing the end of February lows, indicating a sharp shift toward extreme fear as market participants brace for further downside.
Persistent drop in institutional demand adds to bearish pressure
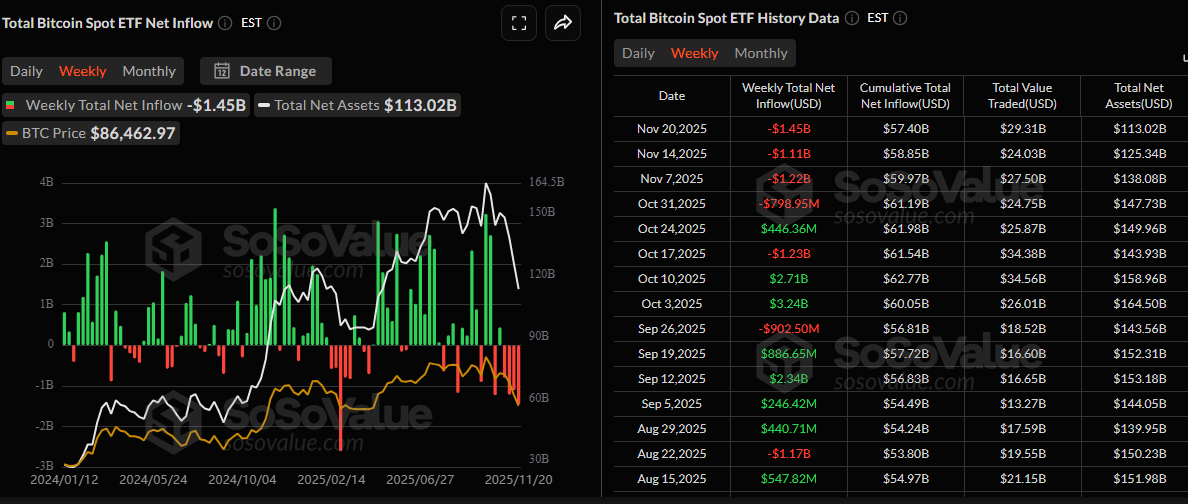
The Bitcoin price drop is further fueled by weakness in institutional demand, with Bitcoin spot ETFs posting $1.45 billion in net outflows so far this week, marking a fourth consecutive week of withdrawals since the end of October. Moreover, on Thursday, it recorded an outflow of $903.11 million, the second-largest single-day negative flow since ETFs launch and the highest level since February 25. If this trend persists and intensifies, Bitcoin could face a deeper price correction, reflecting waning institutional confidence.
On-chain indicators continue to flash bearish signals
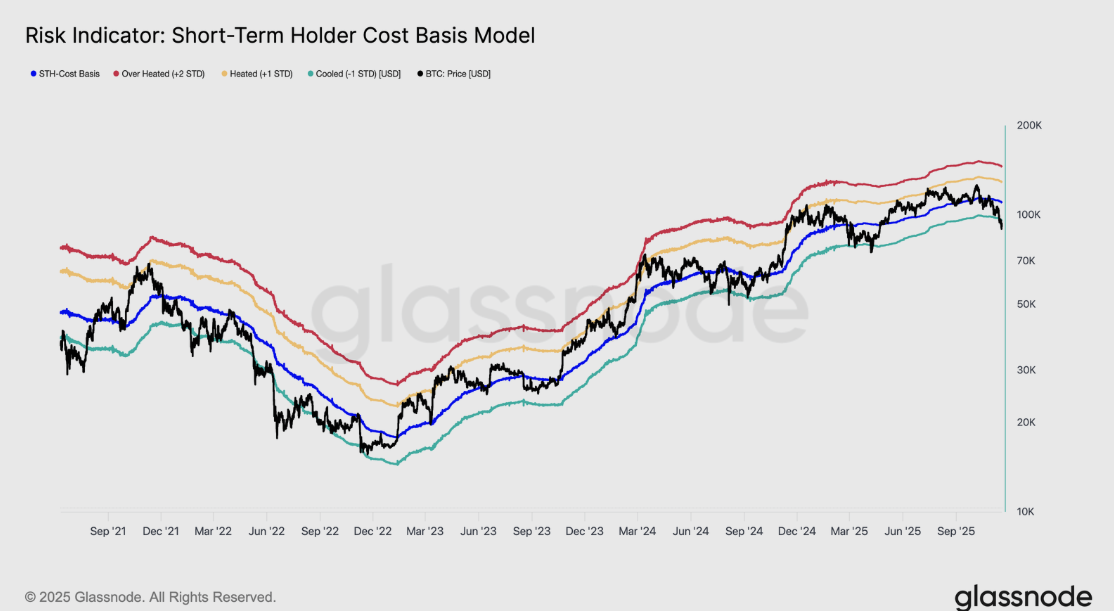
Glassnode’s weekly report on Wednesday highlighted a clear shift in Bitcoin’s market structure, with a decisive breakdown below $97,000. BTC then plunged to $89,000, marking a new local low below the one standard deviation band ($95,400) relative to the short-term holder (STH) cost basis, now near $109,500 as shown in the chart below.
This breakdown confirms that losses now dominate nearly all recent investor cohorts, a structure that has historically triggered panic selling and weakened momentum, requiring time for the market to heal. In the short term, the $95,000–$97,000 range has flipped into resistance, and reclaiming this zone would be the first sign the market is inching back toward equilibrium, according to the Glassnode analyst.
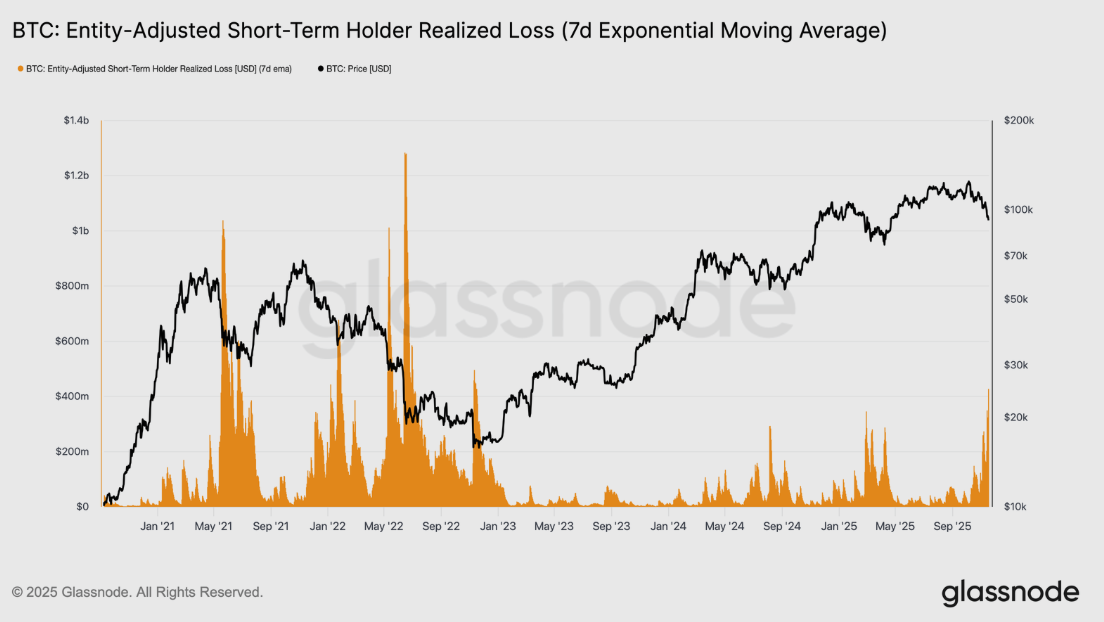
The report further explained that a sharp rise in investor capitulation further supports the bearish outlook. This is the third instance since early 2024 where BTC has broken below the lower band of the STH cost-basis model, but the scale of distress is significantly greater. The 7-day EMA of STH realized losses has spiked to $523 million per day, the highest level recorded since the FTX collapse.
“Such elevated loss realization highlights the heavier top structure built between $106,000–$118,000, far denser than previous cycle peaks. This means either stronger demand must emerge to absorb distressed sellers, or the market will require a longer, deeper accumulation phase before regaining equilibrium,” said the analyst.
Key Bitcoin levels to monitor
Historical data show that in March 2024, BTC fell 33.57% from its all-time high, while the tariff-driven sell-off in the first quarter of 2025 resulted in a 31.95% drawdown. A decline of similar magnitude today would place BTC in the $84,000–$86,000 range. K33 analysts warn that the resurgence of leverage in the derivatives market could be the catalyst that drags prices toward these levels — or even deeper.
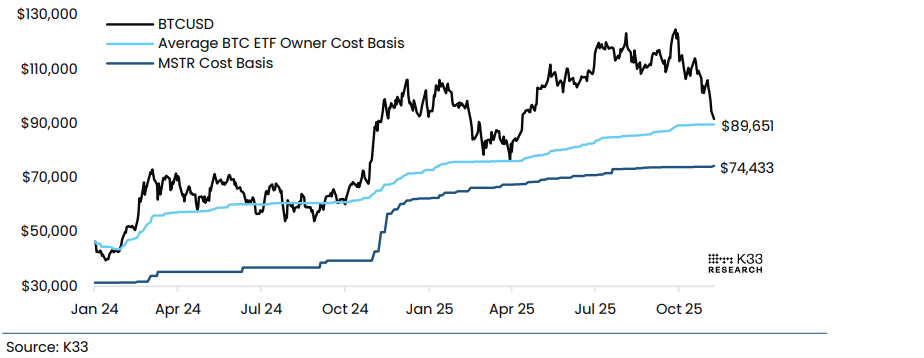
The graph below shows that the average cost basis of BTC ETF holders is $89,651, a threshold Bitcoin briefly broke at its Tuesday low of $89,183, and is now trading below it on Friday. During the the first quarter downturn, BTC bottomed exactly at this average ETF entry level before staging a recovery, making it a key area to watch again if BTC recovers.
Another widely watched level is MicroStrategy’s cost basis at $74,433, which aligns with Bitcoin’s April 7 low. While some traders mistakenly believe that a break below this level would force MicroStrategy to sell, the price zone itself remains a significant psychological target that market participants may attempt to chase in a deeper drawdown.
How low can BTC go?
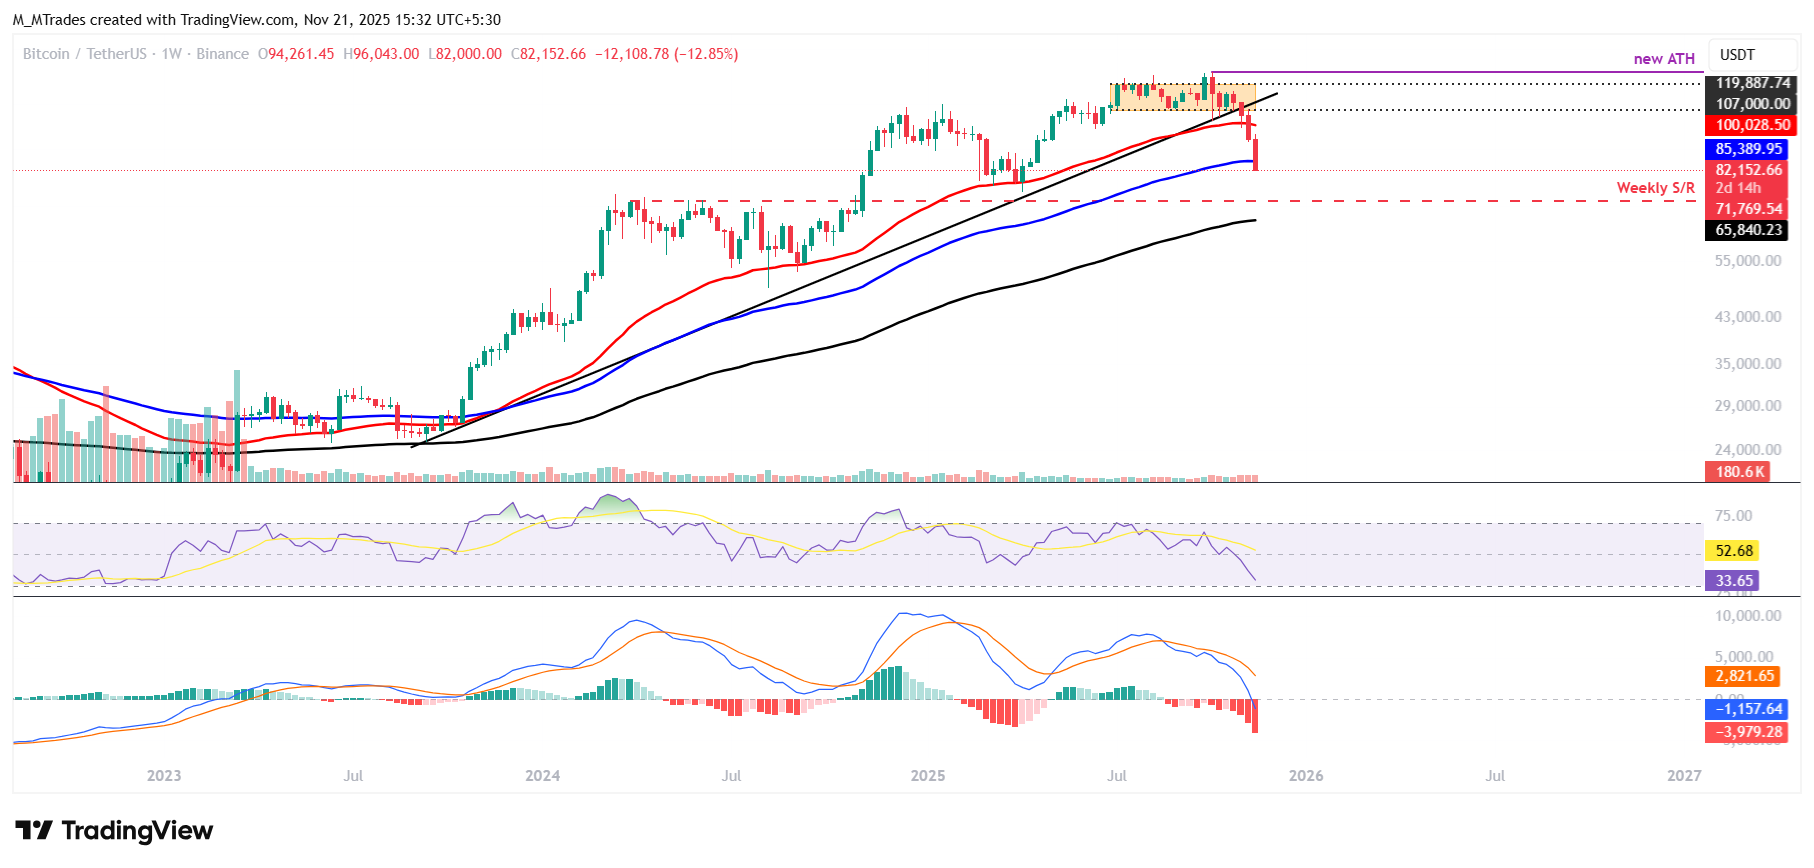
Bitcoin’s weekly chart shows a correction of more than 34% from its all-time high of $126,199 over the past seven weeks, with the price hitting a low near $82,000 on Friday and trading below the 100-week Exponential Moving Average (EMA) around $85,389.
If BTC continues its correction, and the weekly candle closes below the 100-week EMA at $85,389, it could extend the correction toward the weekly support at $71,769.
The Relative Strength Index (RSI) on the weekly chart reads 33, declining below its neutral level of 50, suggesting bearish momentum is gaining traction. Additionally, the Moving Average Convergence Divergence (MACD) indicator showed a bearish crossover that remains intact, with rising red histogram bars below the zero level signaling continuation of the bearish trend.
On the daily chart, Bitcoin breaks below the 78.6% Fibonacci retracement level at $85,569 (drawn from the April 7 low of $74,508 to the all-time high of $126,299 set on October 6) to trade around $82,000 at the time of writing on Friday.
If BTC continues its downward trend, it could extend the decline toward the key psychological level at $80,000.
The Relative Strength Index (RSI) on the daily chart stands at 20, indicating strong bearish momentum and oversold conditions for Bitcoin. Meanwhile, the MACD indicator also shows that sellers are in control amid increasing red histogram bars below the zero line.
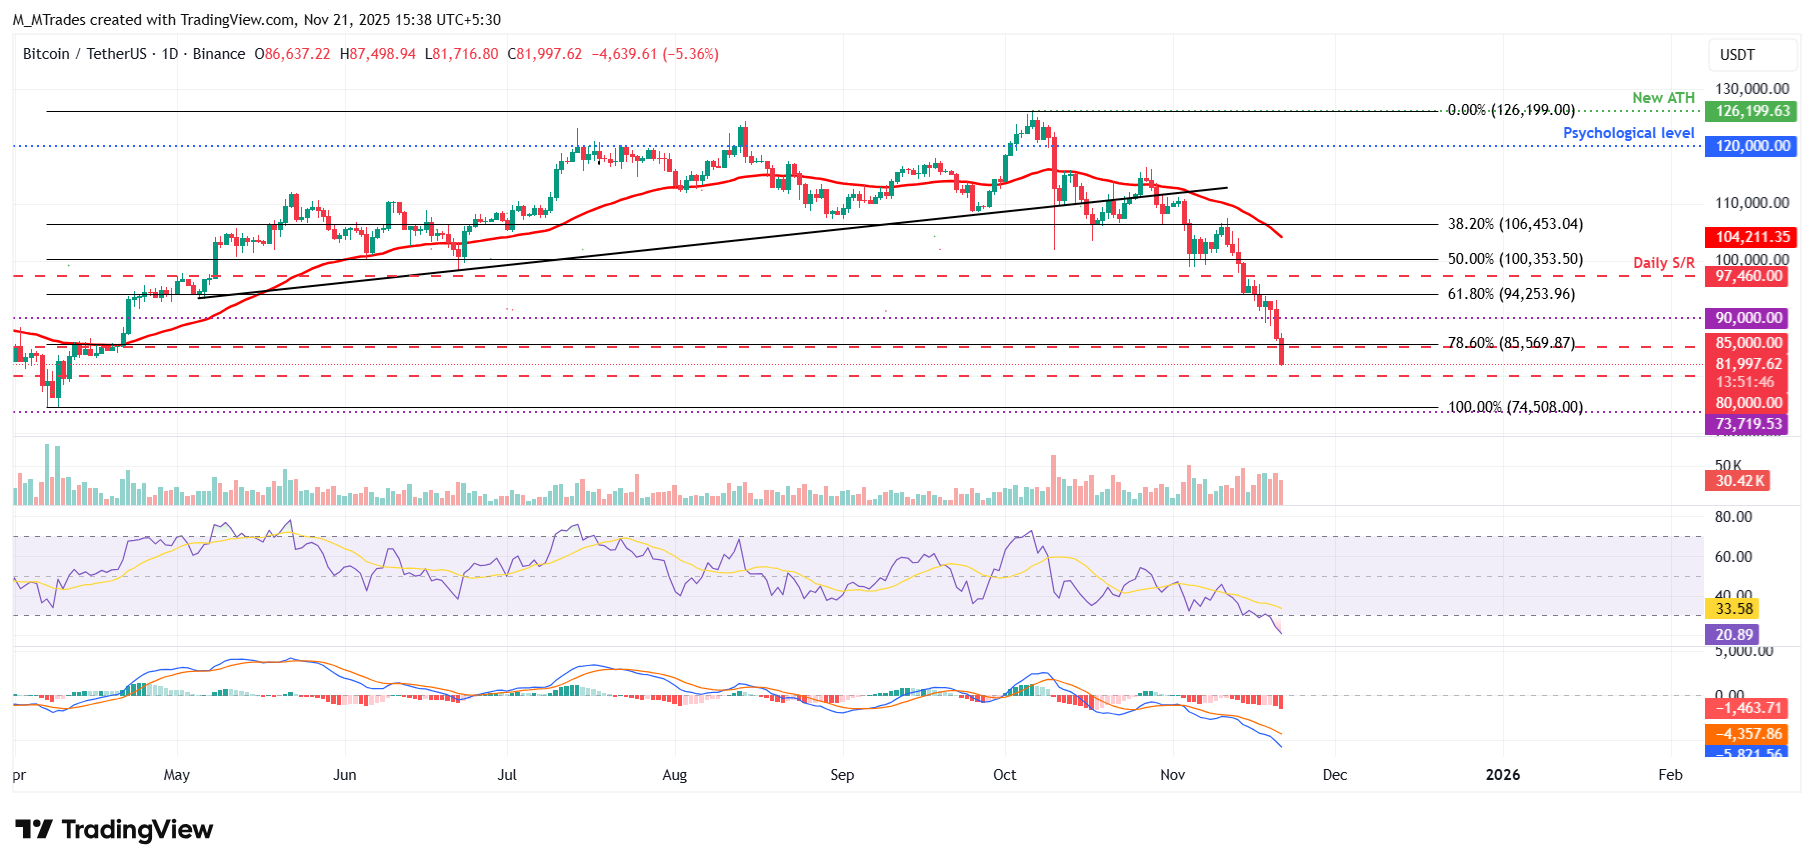
On the other hand, if BTC recovers, it could extend the recovery toward the next resistance level at $85,000.
Bitcoin, altcoins, stablecoins FAQs
Bitcoin is the largest cryptocurrency by market capitalization, a virtual currency designed to serve as money. This form of payment cannot be controlled by any one person, group, or entity, which eliminates the need for third-party participation during financial transactions.
Altcoins are any cryptocurrency apart from Bitcoin, but some also regard Ethereum as a non-altcoin because it is from these two cryptocurrencies that forking happens. If this is true, then Litecoin is the first altcoin, forked from the Bitcoin protocol and, therefore, an “improved” version of it.
Stablecoins are cryptocurrencies designed to have a stable price, with their value backed by a reserve of the asset it represents. To achieve this, the value of any one stablecoin is pegged to a commodity or financial instrument, such as the US Dollar (USD), with its supply regulated by an algorithm or demand. The main goal of stablecoins is to provide an on/off-ramp for investors willing to trade and invest in cryptocurrencies. Stablecoins also allow investors to store value since cryptocurrencies, in general, are subject to volatility.
Bitcoin dominance is the ratio of Bitcoin's market capitalization to the total market capitalization of all cryptocurrencies combined. It provides a clear picture of Bitcoin’s interest among investors. A high BTC dominance typically happens before and during a bull run, in which investors resort to investing in relatively stable and high market capitalization cryptocurrency like Bitcoin. A drop in BTC dominance usually means that investors are moving their capital and/or profits to altcoins in a quest for higher returns, which usually triggers an explosion of altcoin rallies.
Recommended Articles


