

GBP/USD climbs as jobless claims dent USD despite soft UK GDP
- GBP/USD rises as higher US jobless claims pressure the Dollar after strong payrolls.
- UK GDP slows, boosting expectations of a rate cut by the Bank of England.
- Political uncertainty surrounding Keir Starmer remains a headwind for Sterling.
The Pound Sterling rallies during the North American session versus the US Dollar, after the jobs data in the US, contradicts a stellar Nonfarm Payrolls report released a day ago. Meanwhile, the UK economy grew weaker than expected, yet the British Pound continues to trade with gains. The GBP/USD trades at 1.3664, up 0.28%.
Sterling advances after weaker US claims data offset strong NFPs, even as UK growth underwhelms
The Greenback is extending its losses after the latest Initial Jobless Claims report from the US Department of Labor witnessed a slight rise. Claims for the week ending February 7, rose by 227K, down from a previous print of 232K but exceeded forecasts of 222K.
The data is consistent with the recent trend. The jobless claims 4-week average stand at around 219.5K, and although it grew by 7K compared to the previous reading, the labor market shows signs of stabilizing.
On Wednesday, the US Bureau of Labor Statistics (BLS) revealed that the US economy created over 130K new jobs, according to January’s Nonfarm Payrolls report. consequently, the Unemployment Rate edged two tenths below the Fed’s 4.5% estimate for 2026.
In the UK, Gross Domestic Product (GDP) figures in Q4 2025 dipped from 1.2% to 1% YoY, below estimates of 1.2%. On a quarterly basis, the British economy grew 0.1%, unchanged from the quarter of July-September, beneath forecasts of 0.2% increase.
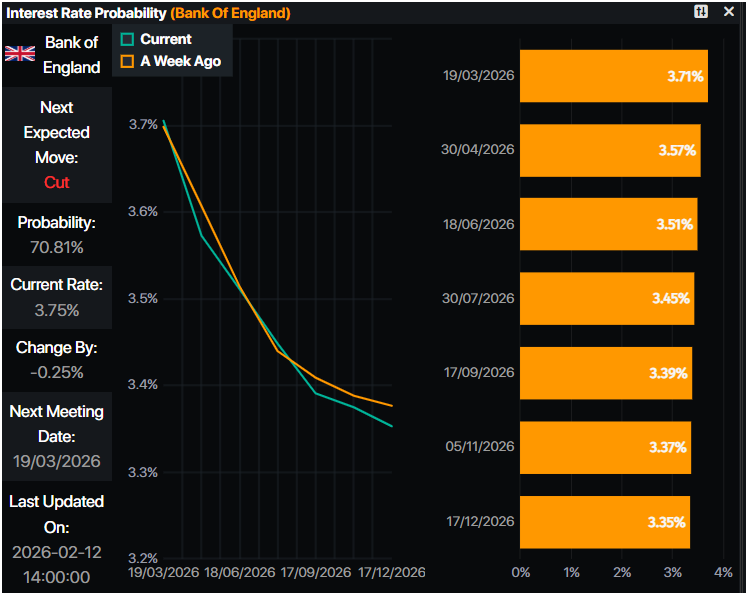
Given the backdrop and a dip on inflation data, had pushed investors to increase bets that the Bank of England could cut interest rates rather sooner than later.
Money markets had priced in a 70% chance of a rate cut by the BoE on the March 19 meeting, according to Prime Market Terminal data.
Nick Rees, the Head of Macro at Monex commented that politics are not creating a positive backdrop for GBP. He added that “If we get the repeated stories about Keir Starmer's judgments that resurrects the commentary and the speculation about him potentially being replaced, ... that's still negative.”
On Friday, GBP/USD traders will eye US inflation figures. In the UK, the BoE Chief Economist Huw Pill would grab the headlines.
GBP/USD Price Forecast: Technical outlook
In the daily chart, GBP/USD trades at 1.3667. The simple moving average slopes higher, last near 1.3506, reinforcing a positive bias. Price holds above this gauge, keeping the near-term structure oriented upward.
The rising trend line from 1.3035 underpins the advance, with support converging near 1.3484. Holding above this area would keep buyers in control and extend the topside bias. A daily close below the line would flag fatigue and open a deeper pullback toward the moving average.
(The technical analysis of this story was written with the help of an AI tool.)
Pound Sterling Price This week
The table below shows the percentage change of British Pound (GBP) against listed major currencies this week. British Pound was the strongest against the US Dollar.
| USD | EUR | GBP | JPY | CAD | AUD | NZD | CHF | |
|---|---|---|---|---|---|---|---|---|
| USD | -0.58% | -0.52% | -2.92% | -0.56% | -1.63% | -0.84% | -1.19% | |
| EUR | 0.58% | 0.06% | -2.42% | 0.01% | -1.06% | -0.27% | -0.62% | |
| GBP | 0.52% | -0.06% | -2.15% | -0.04% | -1.12% | -0.32% | -0.68% | |
| JPY | 2.92% | 2.42% | 2.15% | 2.47% | 1.38% | 2.21% | 1.72% | |
| CAD | 0.56% | -0.01% | 0.04% | -2.47% | -0.96% | -0.26% | -0.64% | |
| AUD | 1.63% | 1.06% | 1.12% | -1.38% | 0.96% | 0.81% | 0.45% | |
| NZD | 0.84% | 0.27% | 0.32% | -2.21% | 0.26% | -0.81% | -0.36% | |
| CHF | 1.19% | 0.62% | 0.68% | -1.72% | 0.64% | -0.45% | 0.36% |
The heat map shows percentage changes of major currencies against each other. The base currency is picked from the left column, while the quote currency is picked from the top row. For example, if you pick the British Pound from the left column and move along the horizontal line to the US Dollar, the percentage change displayed in the box will represent GBP (base)/USD (quote).
Recommended Articles


