


Natural Gas - Futures (NATGAS-F) Is down 2.50% on Oct 25: What You Need to Watch
Natural Gas - Futures (NATGAS-F) is down 2.50% at Oct 25 18:05(ET), now at $2.962, with a 7-day down of 4.73%.
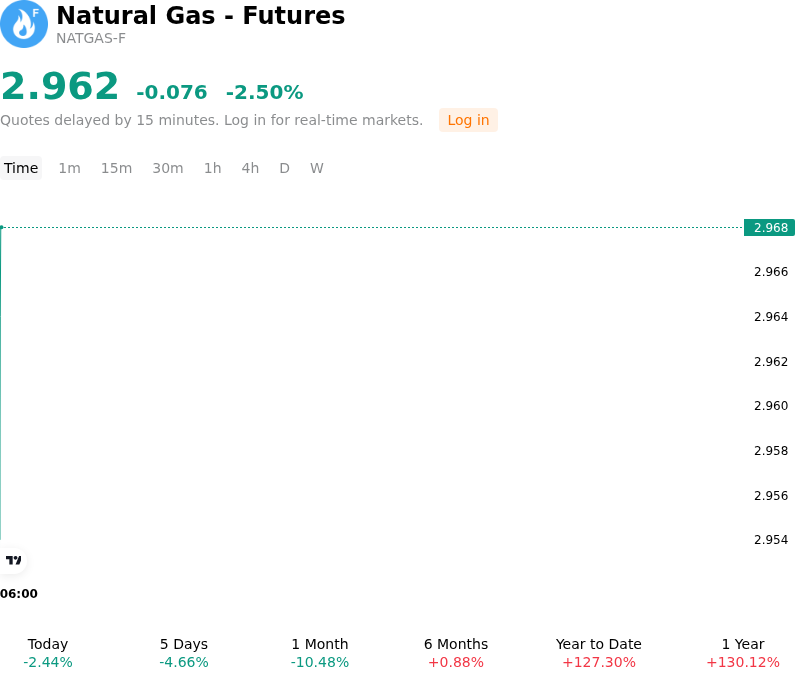
What is driving Natural Gas - Futures (NATGAS-F)’s stock price down today?
U.S. natural gas futures retreated as updated weather forecasts projecting unseasonably mild temperatures across key Midwest and Eastern heating regions eroded expectations for early winter space heating demand. Reduced gas-weighted heating degree day projections for late October and early November signaled a delayed start to the traditional winter heating season, shifting near-term market balances toward a looser supply-demand profile.
The pullback in heating demand coincided with persistent domestic production strength across Lower 48 basins. High associated gas production in the Permian and Haynesville plays, alongside recovering output following seasonal pipeline maintenance in Appalachia, kept domestic dry gas supply elevated near record levels. The robust supply backdrop underscored market confidence that production capacity remains more than sufficient to absorb regional demand shifts without tightening spot availability.
Inventory dynamics further reinforced the downside pressure. With underground storage levels remaining comfortable relative to five-year historical averages as the injection season approaches its final weeks, market participants repriced the expected inventory buffer heading into November. Softening domestic consumption allows weekly storage builds to remain resilient, ensuring that inventory balances entering the withdrawal season will provide an ample cushion against potential weather-driven demand spikes.
While elevated liquefied natural gas export feedgas demand and strong international benchmark pricing continue to provide underlying structural support, near-term price action remains governed by domestic weather patterns and seasonal storage fundamentals. In the absence of sustained cold snaps to trigger heavy residential and commercial drawdowns, institutional positioning reflects a defensive posture, prioritizing excess domestic supply and mild autumn temperature outlooks over broader long-term demand drivers.
Technical Analysis of Natural Gas - Futures (NATGAS-F)
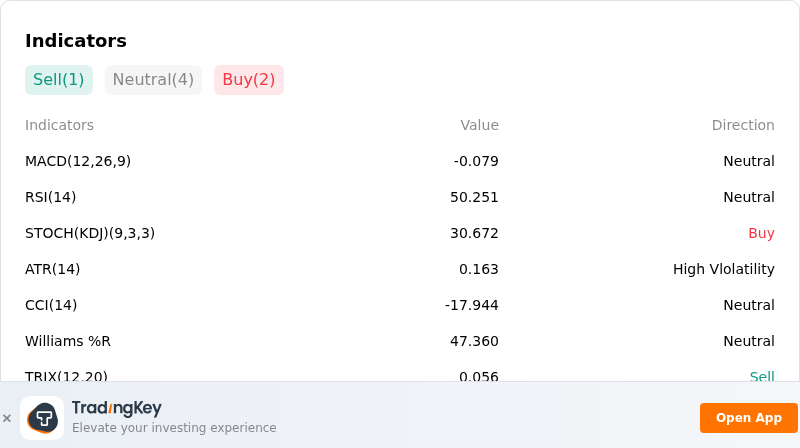
Technically, Natural Gas - Futures (NATGAS-F) shows a MACD (12,26,9) value of -0.079, indicating a neutral signal. The RSI at 50.251 suggests neutral condition and the Williams %R at 47.360 suggests neutral condition. Please monitor closely.
More details about Natural Gas - Futures (NATGAS-F)
Recent Events and Risks:
- Unseasonably Mild Weather Forecasts: Short- and medium-term weather models project widespread above-normal temperatures across major U.S. heating regions through early November, significantly depressing total degree days and eroding early-season residential heating demand.
- Rapid Dry Gas Production Recovery: Lower-48 dry gas output has quickly recovered from Hurricane Isaias shut-ins and regional maintenance, rebounding toward 111.5–112.9 Bcf/d and flooding the domestic grid with heavy physical supply.
- Sustained Storage Surplus: The latest EIA storage report registered a 77 Bcf weekly build, raising total Lower-48 working gas in storage to 3,644 Bcf. Keeping inventories 1.0% above the five-year average suppresses early-winter supply panic and invites speculative short positioning.
- Physical Hub Softness and Pipeline Bottlenecks: Falling gas-fired power burn alongside localized pipeline capacity restrictions across key Eastern transit routes have pressured regional spot prices, exerting dragged intraday momentum on prompt-month Henry Hub futures.
Recommended Articles


