


Interactive Brokers Group Inc Stock (IBKR) Closed Down by 3.83% on Oct 14: Drivers Behind the Movement
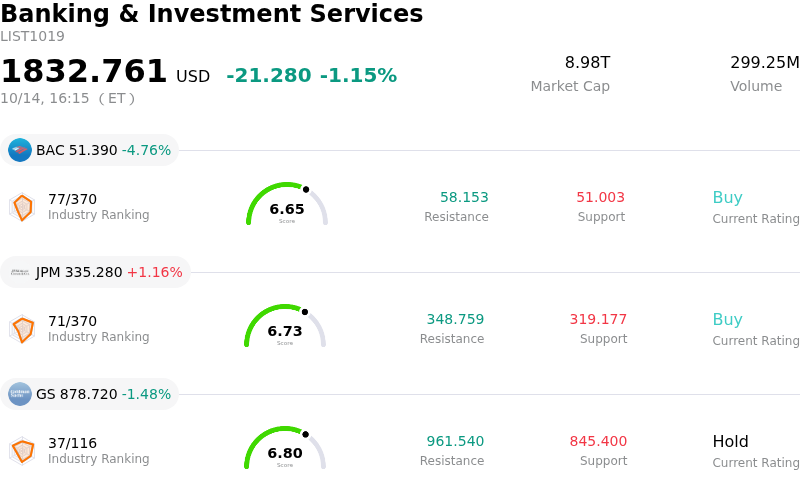
Interactive Brokers Group Inc (IBKR) closed down by 3.83%. The Banking & Investment Services sector is down by 1.15%. The company underperformed the industry. Top 3 stocks by turnover in the sector: Bank of America Corp (BAC) down 4.76%; JPMorgan Chase & Co (JPM) up 1.16%; Goldman Sachs Group Inc (GS) down 1.48%.
What is driving Interactive Brokers Group Inc (IBKR)’s stock price down today?
Interactive Brokers Group experienced notable downward price volatility as broader weakness across the financial sector and pre-earnings position adjustments weighed on investor sentiment. With the company scheduled to report its third-quarter financial results shortly, market participants chose to reduce exposure following recent valuation gains. Elevated Treasury yields, yield curve movements, and shifting Federal Reserve interest rate expectations added pressure across financial services and brokerage equities. Given that net interest income represents a significant portion of the firm's total revenue, shifting interest rate expectations continue to generate cautious trading ahead of quarterly financial reports.
In addition to macro headwinds, company-specific operational trends and recent product announcements drew focused scrutiny from institutional investors. While Interactive Brokers recently reported robust year-over-year increases in total client accounts and client equity, monthly performance metrics indicated a modest sequential moderation in daily average revenue trades compared to prior months, raising questions regarding near-term trading volume velocity. Meanwhile, the company announced the launch of Ethereum cryptocurrency staking for eligible clients in partnership with Zero Hash. Although this strategic move enhances the platform's multi-asset appeal against specialized crypto exchanges, ongoing volatility in digital asset markets and client exit queue considerations limited its immediate ability to counter broader market selling pressure.
Despite the current pull-back, fundamental indicators for Interactive Brokers remain underpinned by long-term structural drivers, including global account expansion, strong market share in active trading and institutional custody, and elevated margin lending balances. However, trading at a premium valuation relative to traditional financial peers leaves the stock susceptible to heightened intraday swings ahead of catalyst events. Investors will closely watch the upcoming earnings release for guidance on net interest margins, account growth trajectory, and customer commission revenue to assess whether current growth metrics justify valuation levels.
Technical Analysis of Interactive Brokers Group Inc (IBKR)
Technically, Interactive Brokers Group Inc (IBKR) shows a MACD (12,26,9) value of -0.352, indicating a sell signal. The RSI at 38.497 suggests neutral condition and the Williams %R at 93.452 suggests oversold condition. Please monitor closely.
Media Coverage of Interactive Brokers Group Inc (IBKR)
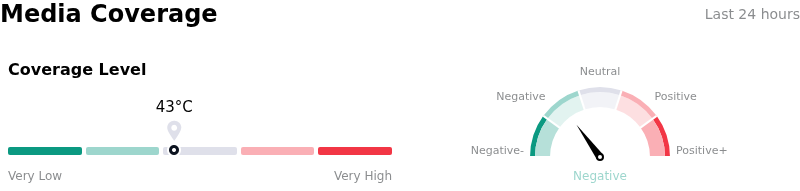
In terms of media coverage, Interactive Brokers Group Inc (IBKR) shows a coverage score of 43, indicating a moderate level of media attention. The overall market sentiment index is currently in bearish zone.
Fundamental Analysis of Interactive Brokers Group Inc (IBKR)
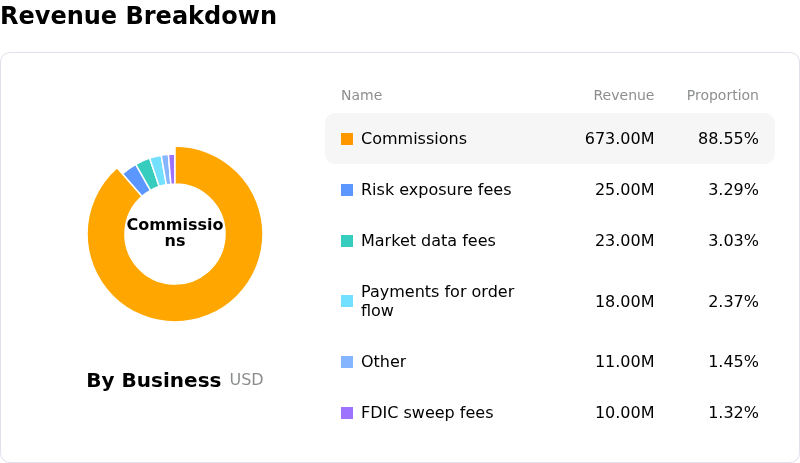
Interactive Brokers Group Inc (IBKR) is in the Banking & Investment Services industry. Its latest annual revenue is $10.00B, ranking 24 in the industry. The net profit is $984.00M, ranking 24 in the industry. Company Profile
Over the past month, multiple analysts have rated the company as Buy, with an average price target of $104.42, a high of $121.00, and a low of $72.18.
More details about Interactive Brokers Group Inc (IBKR)
Company Specific Risks:
- Pre-Earnings Valuation & Execution Pressure: Ahead of its Q3 2026 financial report scheduled for October 15, IBKR faces heightened intraday volatility due to stretched valuation multiples near 35x earnings, leaving shares vulnerable to severe pullbacks if Net Interest Income (NII) or EPS misses consensus expectations of $0.66 to $0.69 per share.
- Trading Volume Deceleration & Commission Growth Fading: Recent monthly brokerage disclosures indicate a cooling in Daily Average Revenue Trades (DARTs) from early-year highs, prompting institutional concerns over sequential commission revenue compression and weakening transactional volume momentum.
- Net Interest Margin Compression Concerns: Core earnings driven by yields on customer cash balances and margin lending face headwinds from potential interest rate easing and the non-recurrence of previous one-off securities lending revenue surges.
- Third-Party & Regulatory Exposure in Crypto Staking Launch: The October 13 launch of Ethereum crypto-staking services through third-party vendor Zero Hash introduces heightened regulatory oversight risk and counterparty exposure within the firm's digital asset operations.
Recommended Articles


