


Wells Fargo & Co Stock (WFC) Closed Down by 3.10% on Oct 13: Facts Behind the Movement
Wells Fargo & Co (WFC) closed down by 3.10%. The Banking & Investment Services sector is down by 0.62%. The company underperformed the industry. Top 3 stocks by turnover in the sector: JPMorgan Chase & Co (JPM) down 0.86%; Goldman Sachs Group Inc (GS) down 0.23%; Bank of America Corp (BAC) down 1.14%.
What is driving Wells Fargo & Co (WFC)’s stock price down today?
Wells Fargo experienced notable downward pressure and heightened intraday volatility following the release of its third-quarter financial results. Although the banking giant reported headline diluted earnings per share that slightly topped consensus expectations, investor sentiment was weighed down by a top-line revenue shortfall against Wall Street estimates. The revenue miss underscored ongoing challenges in converting volume growth across loans and deposits into robust top-line expansion, initiating immediate profit-taking and selling activity across the financial sector.
A key driver of the market's negative reaction was the composition and quality of the quarterly profit beat. The bottom-line outperformance was largely supported by a discrete income tax benefit, concealing underlying operational softness in core fee-generating businesses. Segment analysis revealed noticeable weakness within the Corporate and Investment Banking division, where fixed-income trading revenues and capital markets activity lagged expectations. Lower returns from venture capital investments and reduced lease income following prior asset sales further dragged on noninterest income, offsetting strength in consumer banking and wealth management.
Furthermore, management's decision to maintain, rather than lift, its full-year net interest income guidance provided limited forward momentum to offset the quarter's top-line disappointment. While balance sheet expansion remained healthy with expanding loan and deposit bases, narrow lending spreads in corporate segments continued to cap overall net interest margin expansion. Combined with persistent macroeconomic uncertainties and recent regulatory scrutiny, the lower-than-expected revenue and tax-dependent earnings quality prompted institutional portfolio adjustments, driving the stock lower throughout the trading session.
Technical Analysis of Wells Fargo & Co (WFC)
Technically, Wells Fargo & Co (WFC) shows a MACD (12,26,9) value of 0.320, indicating a neutral signal. The RSI at 40.476 suggests neutral condition and the Williams %R at 59.305 suggests sell condition. Please monitor closely.
Media Coverage of Wells Fargo & Co (WFC)
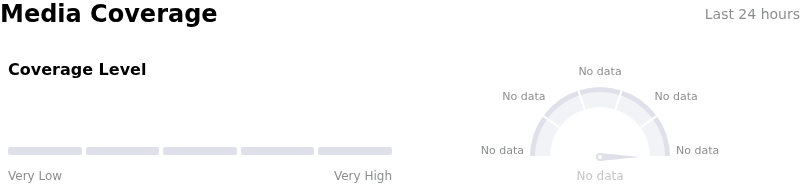
In terms of media coverage, Wells Fargo & Co (WFC) shows a coverage score of 47, indicating a moderate level of media attention. The overall market sentiment index is currently in extremely bullish zone.
Fundamental Analysis of Wells Fargo & Co (WFC)
Wells Fargo & Co (WFC) is in the Banking & Investment Services industry. Its latest annual revenue is $81.45B, ranking 3 in the industry. The net profit is $20.29B, ranking 4 in the industry. Company Profile
Over the past month, multiple analysts have rated the company as Buy, with an average price target of $98.70, a high of $108.00, and a low of $90.00.
More details about Wells Fargo & Co (WFC)
Company Specific Risks:
- Top-Line Revenue Miss and Capital Markets Weakness: Q3 2026 total revenue of $21.87 billion fell short of Wall Street consensus estimates of $22.15 billion, dragged down by a 17% quarter-over-quarter decline in Markets trading revenue and Corporate & Investment Banking revenue missing forecasts at $5.01 billion versus $5.41 billion expected.
- Quality of Earnings Distortion via One-Off Tax Benefit: Although reported Q3 2026 EPS of $1.87 nominally beat consensus estimates of $1.85, the beat was driven by a $170 million discrete tax benefit (approximately $0.05 per share) from resolving prior-period matters, indicating that core operational earnings missed expectations.
- Surge in Credit-Loss Provisions and Commercial Loan Stress: The bank's provision for credit losses escalated 51% year-over-year to $1.029 billion (up from $681 million), driven by rising commercial lending charge-offs, particularly within commercial real estate (CRE) and commercial & industrial portfolios.
- Margin Compression and Noninterest Income Declines: Noninterest income contracted 1% year-over-year due to weaker trading activity, reduced venture capital returns, and lost lease income, while earning asset yields faced pressure from a portfolio mix shift toward lower-margin corporate lending rather than higher-yielding consumer debt.
Recommended Articles


