


BNB (BNBUSD) Is up 1.39% on Oct 11: Key Drivers to Watch
BNB (BNBUSD) is up 1.39% at Oct 11 20:05(ET), now at $749, with a 7-day down of 5.17%.
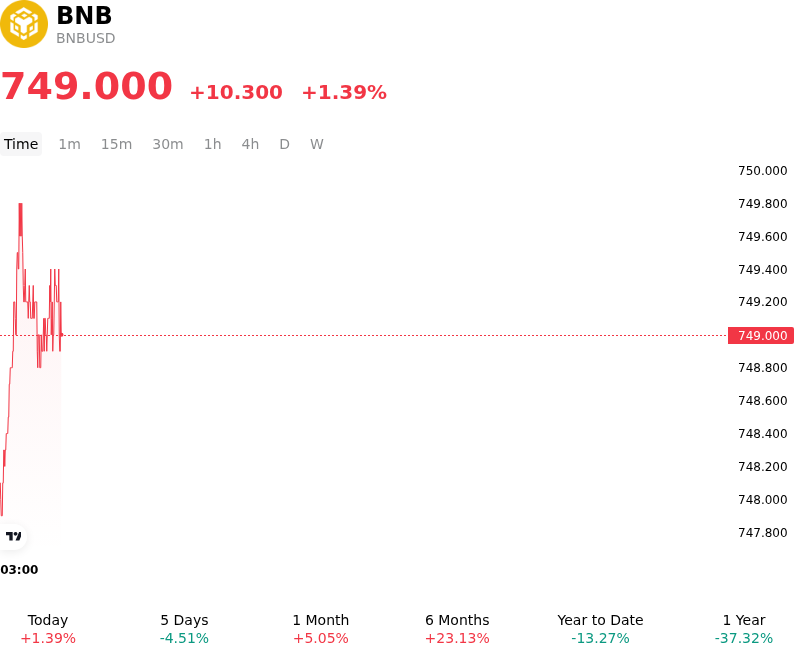
What is driving BNB (BNBUSD)’s stock price up today?
The upward movement in BNB reflected a combination of institutional validation, ecosystem network expansion, and supply-side deflationary positioning. A primary catalyst driving positive sentiment was the launch of the CME Emerging Crypto Index by CME Group and CF Benchmarks, in which BNB was designated as the largest preliminary weighted asset. This institutional inclusion enhanced BNB's profile within benchmark-driven institutional allocations, raising long-term expectations for structural capital flows and exchange-traded product expansion.
Substantive ecosystem developments further supported capital inflows. BNB Chain has continued to expand its market share in real-world asset tokenization and tokenized equities, where growing utility and transaction throughput have driven sustained on-chain velocity. Integrations expanding cross-chain stablecoin utility and consumer wallet capabilities on the network have further reinforced adoption expectations. This elevated network throughput feeds directly into the native gas fee-burning mechanism, reinforcing fundamental value accrual.
From a supply-side perspective, market participants actively positioned ahead of the scheduled mid-October quarterly automated token burn. The expectation of a programmatic contraction in circulating supply incentivized spot accumulation from medium-to-long-term holders, creating a supportive supply-demand dynamic.
In derivatives and technical positioning, the advance was supported by a rebound from short-term oversold conditions near key moving average support levels. Improving risk appetite encouraged buyers to defend dynamic structural support, triggering short-covering and clearing overhead consolidation bounds. While investors continue to monitor regulatory developments, exchange ecosystem concentration, and broader global liquidity conditions, the move reflects a healthy combination of fundamental network demand and programmatic supply tightening.
Technical Analysis of BNB (BNBUSD)
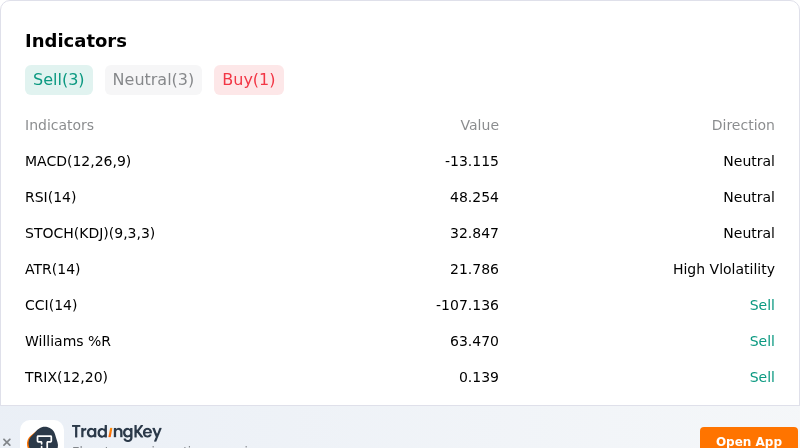
Technically, BNB (BNBUSD) shows a MACD (12,26,9) value of -13.115, indicating a neutral signal. The RSI at 48.254 suggests neutral condition and the Williams %R at 63.470 suggests sell condition. Please monitor closely.
More details about BNB (BNBUSD)
Recent Events and Risks:
- Regulatory and DOJ Compliance Inquiries: Renewed regulatory uncertainty surrounds Binance following reports of U.S. Department of Justice investigations into the exchange's adherence to its 2023 settlement terms, alongside scrutiny from European regulators regarding MiCA compliance, elevating legal and operational risk for BNB.
- Derivatives Unwinding and Technical Resistance Rejection: A sharp rejection at the critical $800 resistance level triggered defensive profit-taking and a leverage flush, resulting in over $11 million in long position liquidations and a $129 million contraction in futures open interest, leaving key support near $730 vulnerable to downside pressure.
- Ecosystem Exploits and On-Chain Supply Overhang: Security vulnerabilities within BNB Chain protocols, highlighted by a $12.5 million exploit on 79thVault that converted stolen funds into over 16,000 BNB, generated direct spot sell pressure and created an overhang of attacker-controlled tokens threatening secondary market liquidity.
- Whale Inflows and Exchange Liquidity Depletion: Increased whale transfers of BNB and altcoins to centralized exchanges signal potential distress liquidations, while a massive 500 million USDT capital transfer from Binance to the Tether Treasury has thinned local stablecoin bid depth during intraday drawdowns.
Recommended Articles


