

NZD/USD (NZDUSD) Drops on Oct 7: Was It the Dollar, Rates, or Data?

Source Tradingkey

NZD/USD (NZDUSD) is down 0.52% at Oct 7 08:20(ET), now at $0.55903, with a 7-day down of 0.74%.
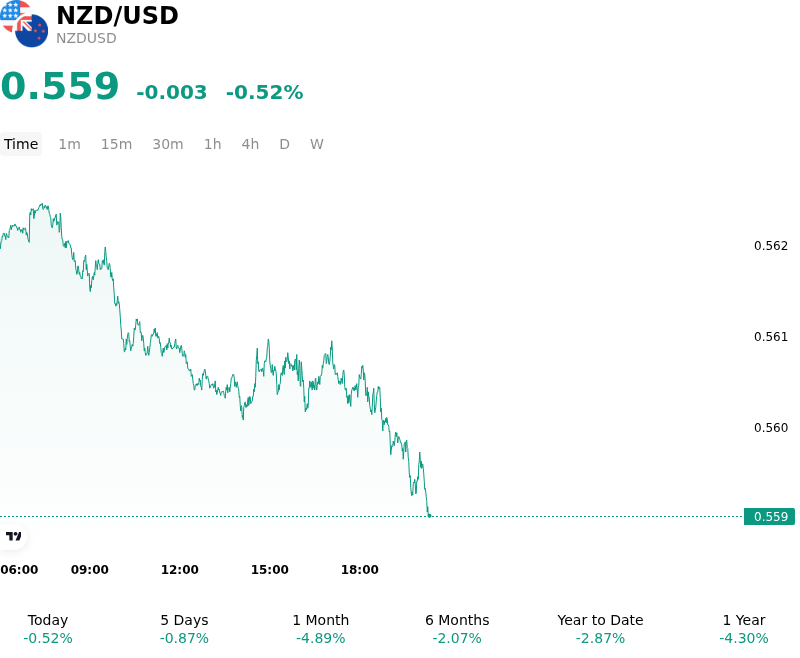
SummaryOverview

What is driving NZD/USD (NZDUSD)’s stock price down today?

The downward pressure on NZD/USD was primarily driven by a broad-based rebound in the US dollar, anchored by rising US Treasury yields and persistent inflation concerns. Hawkish commentary from Federal Reserve officials reinforced market expectations that US monetary policy will remain firm to combat sticky inflationary pressures. This upward momentum in US yields widened interest rate differentials in favor of the greenback, driving institutional capital flows away from the New Zealand dollar ahead of key Federal Reserve policy minutes.

Extending the headwinds for the kiwi, elevated geopolitical tensions in the Middle East and rising global crude oil prices reinforced global inflation risk. While higher energy costs bolster expectations of tight monetary policy worldwide, they simultaneously present a stagflationary drag on New Zealand’s small, open economy by eroding household purchasing power and raising input costs for businesses. Although the Reserve Bank of New Zealand previously delivered back-to-back rate hikes to raise the Official Cash Rate to 2.75%—with money markets expecting additional policy tightening by year-end—fragile domestic growth conditions and political uncertainty ahead of the general election capped fundamental support for the base currency.

From a technical and positioning perspective, the pair faced renewed supply after failing to sustain recovery attempts above dynamic short-term resistance levels. The broader environment of elevated global bond yields and cautious risk sentiment continued to favor defensive allocations into the US dollar over high-beta commodity currencies. Consequently, NZD/USD remains under broader macro pressure until global risk appetite stabilizes or domestic fundamentals provide a stronger catalyst for yield support.

Technical Analysis of NZD/USD (NZDUSD)

Technically, NZD/USD (NZDUSD) shows a MACD (12,26,9) value of -0.001, indicating a sell signal. The RSI at 27.137 suggests sell condition and the Williams %R at 91.929 suggests oversold condition. Please monitor closely.
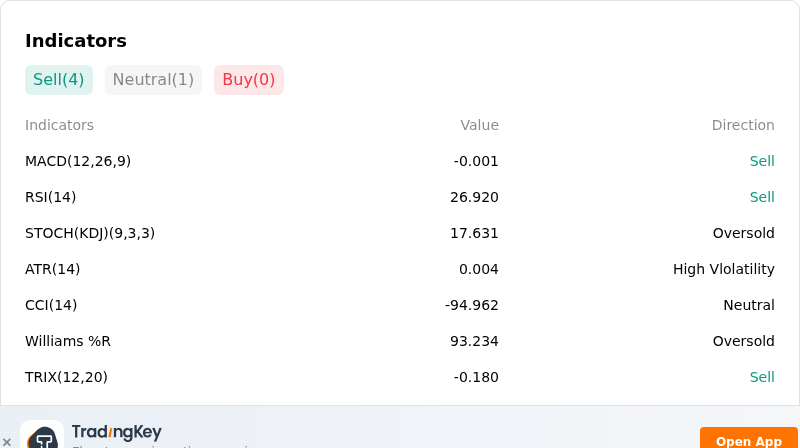
IndicatorAnalysis

More details about NZD/USD (NZDUSD)

Recent Events and Risks:

  • Elevated US Treasury Yields and US Dollar Momentum: Resurgent US Treasury yields, driven by sticky inflation fears and fiscal supply pressures, continue to bolster the US Dollar, maintaining persistent downside pressure on NZD/USD and keeping the pair pinned near multi-year lows around 0.5600.
  • Domestic Activity Contraction and RBNZ Uncertainty: New Zealand's latest Quarterly Survey of Business Opinion (QSBO) showed reported trading activity slipping into negative territory (-1%), exposing underlying domestic demand weakness that complicates the Reserve Bank of New Zealand's policy outlook ahead of its October 28 rate decision.
  • Geopolitical Risk Aversion and Commodity Exposure: Escalating Middle East conflict and energy supply disruption concerns in the Strait of Hormuz have dampened global risk appetite, triggering safe-haven capital flows into the US Dollar at the expense of high-beta growth currencies like the Kiwi.
  • Technical Breakdown and Downside Momentum: NZD/USD continues to trade below key moving averages after six consecutive weekly declines, with persistent short-term negative indicator signals threatening a clean break below critical support at 0.5580 toward lower structural targets.
Disclaimer: For information purposes only. Past performance is not indicative of future results.
placeholder
Gold holds steady below $4,150 amid elevated US yields Gold price (XAU/USD) trades on a flat note near $4,140 during the early Asian session on Tuesday. Pressure from a stronger US Dollar (USD) and elevated US Treasury yields was offset by reduced expectations of a Federal Reserve (Fed) rate hike this month.
Author  FXStreet
Oct 06, Tue
Gold price (XAU/USD) trades on a flat note near $4,140 during the early Asian session on Tuesday. Pressure from a stronger US Dollar (USD) and elevated US Treasury yields was offset by reduced expectations of a Federal Reserve (Fed) rate hike this month.
placeholder
【Daily Brief】Gold rebounds 1% off a two-month low, Nasdaq drops 1.25% and yields ease — the storm premium keeps WTI near $91Gold trades at $4,174 after rebounding from Wednesday's $4,090 two-month low, the Nasdaq fell 1.25% while the Dow edged higher, and the 10-year Treasury eased to 5.23% from the week's highs. Hurricane Isaias keeps about 25% of Gulf output shut in with WTI near $91, and bitcoin holds below $82,000. The next scheduled tests are the EIA report on 15 October and the FOMC on 27-28 October.
Author  Irene Q.
Yesterday 06: 28
Gold trades at $4,174 after rebounding from Wednesday's $4,090 two-month low, the Nasdaq fell 1.25% while the Dow edged higher, and the 10-year Treasury eased to 5.23% from the week's highs. Hurricane Isaias keeps about 25% of Gulf output shut in with WTI near $91, and bitcoin holds below $82,000. The next scheduled tests are the EIA report on 15 October and the FOMC on 27-28 October.
placeholder
Hurricane Isaias has shut in a quarter of Gulf oil output — can WTI clear $92 before Thursday's EIA report?WTI trades at $90.80 after rebounding roughly 3% from Wednesday's $87.96 low as Hurricane Isaias — the Atlantic season's first — forces producers to shut in about 25% of US Gulf of Mexico output. Brent holds at $103.41. The first official read on the disruption arrives with the EIA weekly petroleum report on Thursday 15 October — here are the key levels and both scenarios.
Author  Irene Q.
Yesterday 06: 38
WTI trades at $90.80 after rebounding roughly 3% from Wednesday's $87.96 low as Hurricane Isaias — the Atlantic season's first — forces producers to shut in about 25% of US Gulf of Mexico output. Brent holds at $103.41. The first official read on the disruption arrives with the EIA weekly petroleum report on Thursday 15 October — here are the key levels and both scenarios.
placeholder
US September CPI preview: inflation set to hit 3.7% — will the Fed hike in December?US September CPI lands Wednesday with headline inflation seen at 3.7% y/y and core at 0.2% m/m. December hike odds sit near 70% — here are the scenarios, the calendar and the key levels.
Author  Irene Q.
4 hours ago
US September CPI lands Wednesday with headline inflation seen at 3.7% y/y and core at 0.2% m/m. December hike odds sit near 70% — here are the scenarios, the calendar and the key levels.
placeholder
Gold posts first weekly gain in three weeks — can $4,200 hold through CPI?Spot gold closed at $4,194.645, up 1.47% — its first weekly gain in three weeks — and COMEX futures settled back above $4,200 at $4,220.30. Here are the drivers, the levels and the scenarios into Wednesday's CPI.
Author  Irene Q.
1 hour ago
Spot gold closed at $4,194.645, up 1.47% — its first weekly gain in three weeks — and COMEX futures settled back above $4,200 at $4,220.30. Here are the drivers, the levels and the scenarios into Wednesday's CPI.
goTop
quote