


Banco Santander SA Stock (SAN) Moved Up by 3.29% on Oct 5: Drivers Behind the Movement
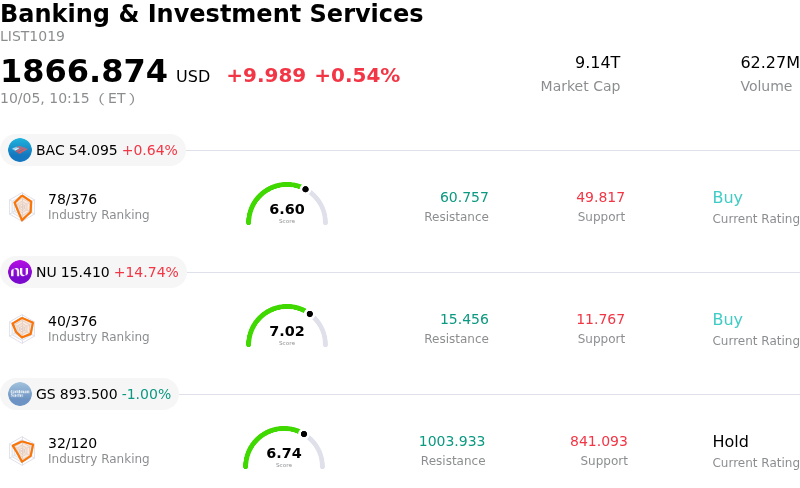
Banco Santander SA (SAN) moved up by 3.29%. The Banking & Investment Services sector is up by 0.54%. The company outperformed the industry. Top 3 stocks by turnover in the sector: Bank of America Corp (BAC) up 0.64%; Nu Holdings Ltd (NU) up 14.78%; Goldman Sachs Group Inc (GS) down 1.00%.
What is driving Banco Santander SA (SAN)’s stock price up today?
Banco Santander ADRs experienced upward momentum accompanied by heightened intraday volatility, driven primarily by strong investor enthusiasm surrounding the company's aggressive shareholder capital return framework and solid operational performance. Investors continue to respond favorably to the bank's recently approved interim cash dividend payout increase and ongoing share buyback execution, which together allocate approximately half of underlying profits back to equity holders. The commitment to sustained double-digit growth in cash distributions, coupled with capital generation from strategic asset divestitures, has significantly reinforced investor confidence in the institution's balance sheet resilience.
Beyond capital returns, fundamental valuation metrics and broader financial sector dynamics played a key role in the price action. Trading at a notable discount to book value relative to global peer banks, Santander attracted strong institutional buying interest following a period of broader sector consolidation. Firm revenue momentum, disciplined expense management, and elevated net interest margins across core European and Latin American markets continue to underpin constructive consensus expectations. At the same time, fluctuations in foreign exchange rates between the Euro and the US Dollar contributed to intraday price swings for the US-listed ADRs, amplifying volatility as currency markets digested shifting macroeconomic data and central bank policy expectations.
Looking forward, market sentiment remains constructive as analysts highlight the bank's clear capital surplus over regulatory targets and its multi-year capital return trajectory. While macro headwinds and broader financial sector sensitivity to global interest rate expectations may sustain short-term price fluctuations, the combination of ongoing share repurchases, upcoming dividend record dates, and robust earnings visibility positions the equity well among international banking peers.
Technical Analysis of Banco Santander SA (SAN)
Technically, Banco Santander SA (SAN) shows a MACD (12,26,9) value of -0.235, indicating a sell signal. The RSI at 43.082 suggests neutral condition and the Williams %R at 59.312 suggests sell condition. Please monitor closely.
Fundamental Analysis of Banco Santander SA (SAN)
Banco Santander SA (SAN) is in the Banking & Investment Services industry. Its latest annual revenue is $65.95B, ranking 5 in the industry. The net profit is $15.90B, ranking 5 in the industry. Company Profile
Over the past month, multiple analysts have rated the company as Buy, with an average price target of $14.71, a high of $15.60, and a low of $13.82.
More details about Banco Santander SA (SAN)
Company Specific Risks:
- Macroeconomic Volatility and Yield Curve Pressure: Surging global bond yields and macro risk-off sentiment have triggered intraday selling pressure on Banco Santander, amplified by the stock's elevated sensitivity to interest rate volatility and a high market beta relative to European banking peers.
- Emerging Market Currency and Geopolitical Exposure: With over 70% of total group earnings generated outside the Eurozone, the bank remains highly exposed to foreign exchange fluctuations and macroeconomic instability in key international markets, particularly in Brazil and broader Latin America.
- Technical Sell Signals and Volume Divergence: Quantitative models and analyst technical indicators highlight early bearish divergence, as recent price rebounds occurred on declining trading volume, triggering short-term moving average sell signals and pressuring key support levels around $13.29.
- M&A Execution and Regulatory Approval Constraints: Large-scale strategic initiatives, including the $12.3 billion acquisition of Webster Financial and multi-year capital distribution plans, remain dependent on multi-jurisdictional US and EU regulatory approvals, introducing transaction execution and integration risks.
Recommended Articles


