


XRP (XRPUSD) Suddenly Goes down 1.75% on Oct 3: What You Need to Watch
XRP (XRPUSD) is down 1.75% at Oct 3 20:05(ET), now at $1.472, with a 7-day down of 2.59%.
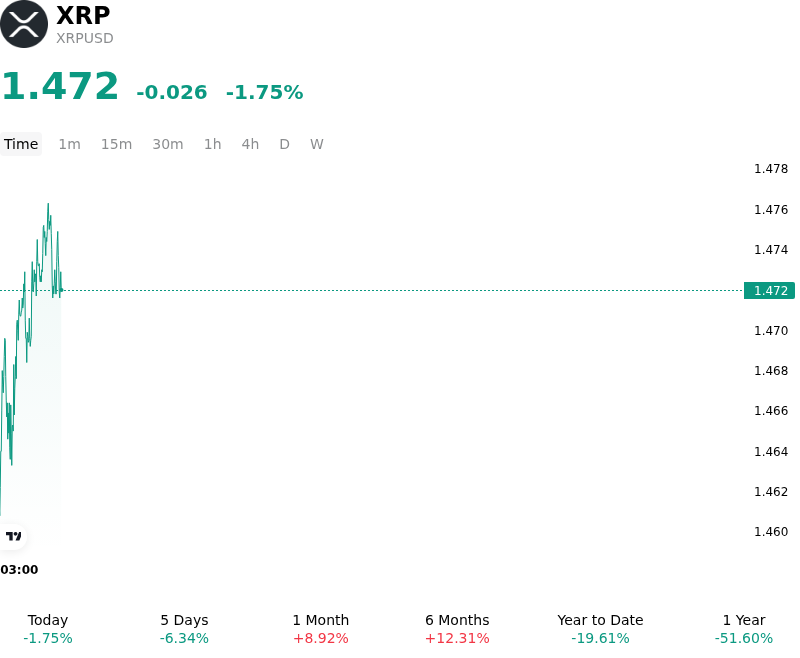
What is driving XRP (XRPUSD)’s stock price down today?
The modest intraday retracement in XRPUSD reflects a combination of macroeconomic headwinds and short-term liquidity repricing across speculative digital assets. Macro sentiment remained constrained by elevated U.S. Treasury yields holding above five percent, alongside lingering uncertainty surrounding the Federal Reserve's upcoming policy trajectory. In an environment where benchmark interest rates remain restrictive, non-yielding risk assets face persistent discount-rate friction, encouraging institutional traders to de-risk and trim leveraged long exposure following a strong prior quarter rally.
Asset-specific selling pressure was further amplified by supply-side dynamics surrounding the start of the month. Ripple's routine release of one billion XRP from its escrow framework, coupled with significant on-chain transfers to secondary market wallets and custodian addresses, temporarily heightened market focus on potential sell-side liquidity. Although the majority of escrow unlocks are historically re-locked, the immediate visibility of large-scale token movements prompted precautionary profit-taking among both spot holders and perpetual swap traders.
Additionally, capital inflows into spot XRP exchange-traded funds showed signs of moderation compared to earlier velocity, providing insufficient net buy pressure to fully absorb localized liquidity supply. As the token faced stiff technical overhead near its established resistance levels, long liquidations in the derivatives market accelerated. The temporary mismatch between institutional ETF absorption and short-term market liquidity driven by leverage unwinding ultimately pressured spot prices lower.
Despite the short-term pullback, market participants continue to monitor the asset within a broader structural context. The fundamental landscape remains supported by expanding enterprise payment infrastructure, institutional treasury initiatives, and evolving digital asset regulatory standards. Investors are closely tracking upcoming monetary policy signals, cumulative spot ETF flow trajectories, and on-chain escrow re-locking confirmations to gauge whether current volatility signals a prolonged consolidation or a temporary market clearing event.
Technical Analysis of XRP (XRPUSD)
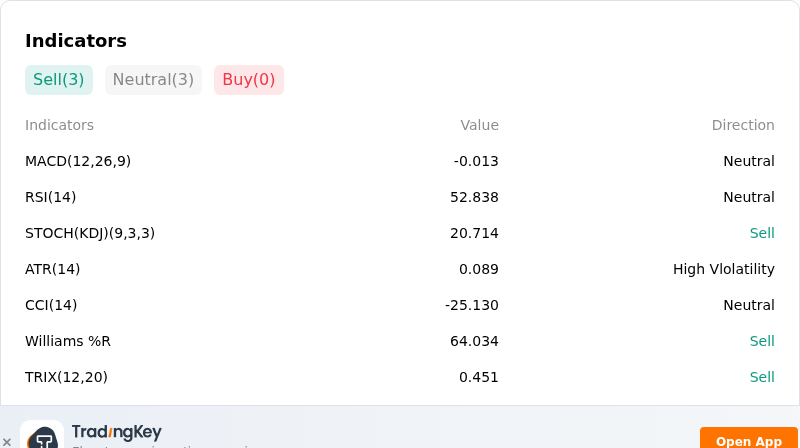
Technically, XRP (XRPUSD) shows a MACD (12,26,9) value of -0.013, indicating a neutral signal. The RSI at 52.838 suggests neutral condition and the Williams %R at 64.034 suggests sell condition. Please monitor closely.
More details about XRP (XRPUSD)
Recent Events and Risks:
- Derivatives Leverage Unwinds and Long Liquidation Spikes: Aggressive bullish leverage in XRP derivatives markets has triggered severe long-side liquidation imbalances during retests of resistance zones, forcing automated liquidations that accelerate intraday price drops below critical technical support levels.
- Stagnating Institutional ETF Demand: Following periods of consistent net inflows into U.S. spot XRP exchange-traded products, institutional demand has temporarily flattened, leaving spot markets lacking sufficient buy-side absorption during periods of increased market-wide selling.
- Heavy Overhead Selling and Structural Escrow Dilution: Substantial sell-side pressure from legacy holders taking profit near high-volume overhead bands ($1.57–$1.66), alongside Ripple's scheduled monthly release of 1 billion XRP from escrow, continues to constrain upside momentum and dilute market depth.
- Macro Risk-Off Sentiment and Regulatory Stalls: Broader market weakness stemming from elevated U.S. Treasury yields and legislative delays regarding comprehensive digital asset market structure bills continues to weigh on investor risk appetite, driving heightened downside volatility across high-beta assets like XRP.
Recommended Articles


