


WTI (USOIL) Volatility Intensified on Oct 2: What to Watch
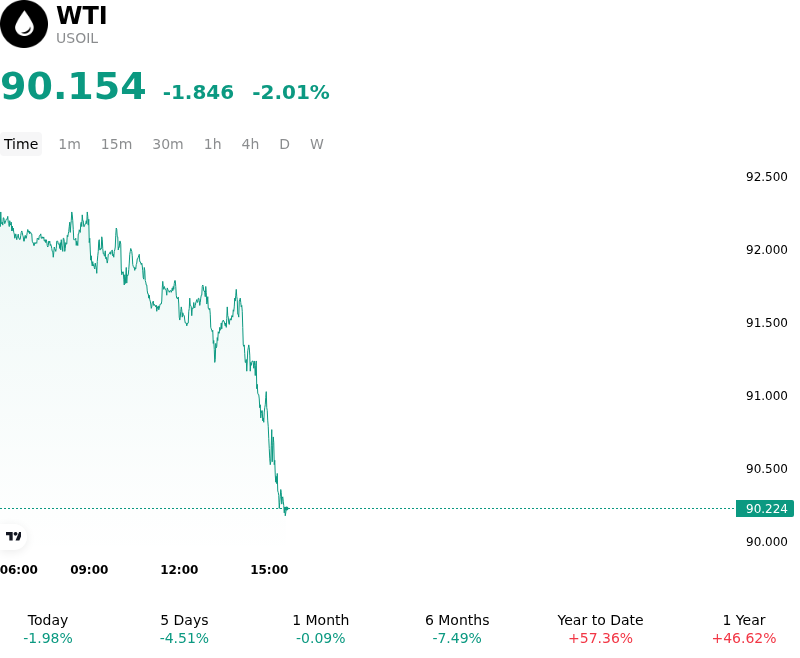
WTI (USOIL) is down 2.01% at Oct 2 03:35(ET), now at $90.154, with a 7-day down of 2.33%.
What is driving WTI (USOIL)’s stock price down today?
The pull-back in West Texas Intermediate crude oil was primarily driven by signs of easing physical supply constraints and a notable recovery in seaborne crude export flows from Middle Eastern producers. Market reports indicating that crude shipments from key Gulf exporters recovered toward near-normal operational levels helped alleviate acute supply disruption fears that had previously built a significant geopolitical risk premium into energy markets. This steadying of physical export volumes effectively offset localized geopolitical headlines, prompting institutional traders to reprice short-term supply risk downward.
Compounding this supply-side relief was the domestic inventory and production landscape in the United States. Recent data from the Energy Information Administration showed an unexpected build in U.S. commercial crude stocks, defying market expectations for a seasonal draw. With U.S. domestic crude production holding firm near record levels around 13.95 million barrels per day, the inventory build highlighted robust supply availability at key storage hubs. The unexpected accumulation of commercial inventories provided an immediate fundamental catalyst for systematic profit-taking and long liquidation across futures contracts.
Furthermore, market sentiment was impacted by domestic policy discussions regarding regional fuel supplies and energy export dynamics, which placed additional downward pressure on the U.S. benchmark relative to international crude prices. Institutional positioning also adjusted ahead of the scheduled OPEC+ policy meeting, where major producers were widely anticipated to keep output targets unchanged rather than implement new supply restrictions. Combined with steadying global flows, the price action reflected a transition from supply-scarcity pricing toward a balanced short-term physical market outlook.
Technical Analysis of WTI (USOIL)
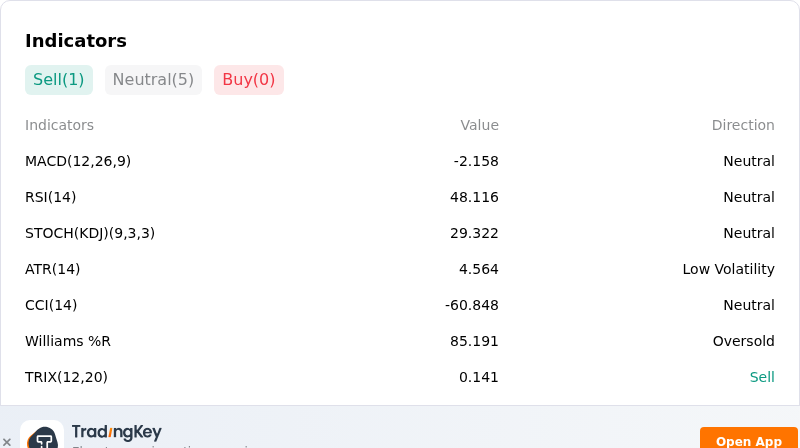
Technically, WTI (USOIL) shows a MACD (12,26,9) value of -2.158, indicating a neutral signal. The RSI at 48.116 suggests neutral condition and the Williams %R at 85.191 suggests oversold condition. Please monitor closely.
More details about WTI (USOIL)
Recent Events and Risks:
- Unexpected U.S. Commercial Crude Stock Build: The U.S. Energy Information Administration reported a 922,000-barrel increase in commercial crude inventories for the week ending September 25, defying consensus market forecasts for a 455,000-barrel drawdown. A simultaneous 553,000-barrel stock increase at the Cushing delivery hub has heightened localized physical oversupply concerns, sparking prompt intraday selling in WTI futures.
- Rebound in Middle Eastern Export Supply: Market data from JPMorgan revealed that crude oil exports from Middle Eastern producers recovered to 17.7 million barrels per day in late September, reaching approximately 98% of pre-conflict levels. The rapid normalization of maritime export flows has eroded geopolitical risk premiums, applying steady downward pressure on global crude benchmarks.
- Record U.S. Domestic Crude Production: EIA weekly reports showed U.S. domestic crude oil output rising to a record high of 13.955 million barrels per day. Expanding U.S. production levels continue to bolster domestic supply availability, limiting room for price spikes and dampening physical market tightness.
- Cooling Producer Sentiment and Macro Softness: The third-quarter Dallas Fed Energy Survey showed the regional business activity index fell to 38.8 from 46.1, with exploration and production executives projecting WTI prices to settle near $88 per barrel by year-end. Slower expansion across domestic shale basins and persistent cost pressures are prompting fund managers to trim speculative long positions.
Recommended Articles


