


Solana (SOLUSD) Is up 1.01% on Oct 1: What Are the Risk Factors?
Solana (SOLUSD) is up 1.01% at Oct 1 01:20(ET), now at $118.23, with a 7-day up of 2.07%.
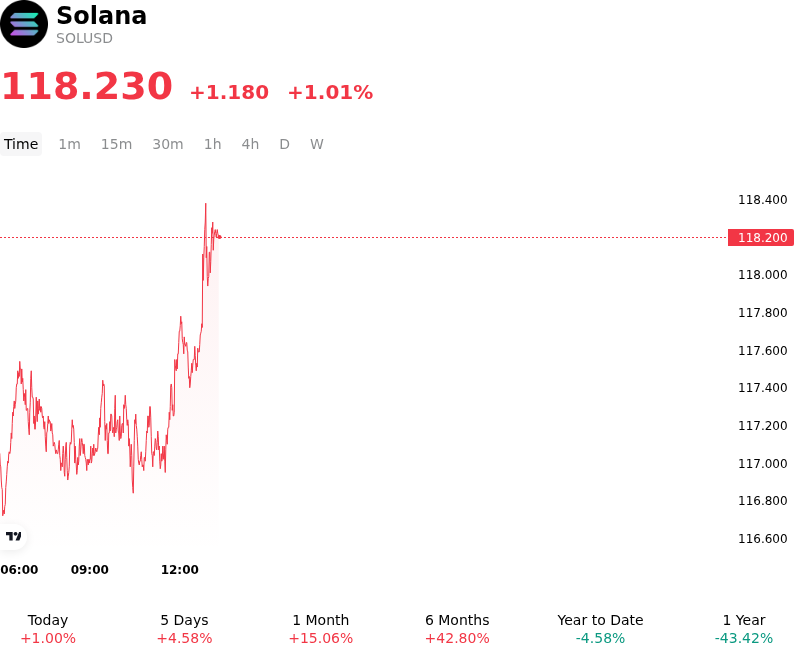
What is driving Solana (SOLUSD)’s stock price up today?
Solana advanced as persistent institutional capital inflows through U.S. spot Solana ETFs provided a strong structural tailwind for the asset. A sustained expansion in fund allocations, dominated by native staking-enabled ETF products, reflects growing institutional appetite for high-throughput Layer-1 assets offering integrated yield. This institutional bid has effectively absorbed secondary market sell-side liquidity, tightening overall floating supply and bolstering market confidence entering the fourth quarter. Broad market risk sentiment was further supported by accommodative macroeconomic conditions, where stabilizing Treasury yields and steady global liquidity encouraged capital rotation into alternative smart contract platforms.
Beyond fund flows, robust underlying network activity reinforced investor sentiment and adoption expectations. Sustained trading volumes across Solana's decentralized exchange protocols and expanding decentralized finance ecosystems continue to drive utility-based demand for the native token. Furthermore, the ongoing growth of tokenized real-world assets deployed on the blockchain has highlighted Solana's increasing integration with institutional financial infrastructure, strengthening its fundamental investment thesis.
From a market structure perspective, the upward momentum was accelerated by constructive positioning in crypto derivatives markets. As spot prices held key technical support levels, leverage traders expanded long exposures, while localized short positions faced systematic liquidations. Positive funding rates across perpetual swap markets indicate healthy risk appetite and institutional participation. Investors continue to monitor global macroeconomic shifts, regulatory developments, and long-term network scaling requirements as key variables driving sustained price discovery.
Technical Analysis of Solana (SOLUSD)
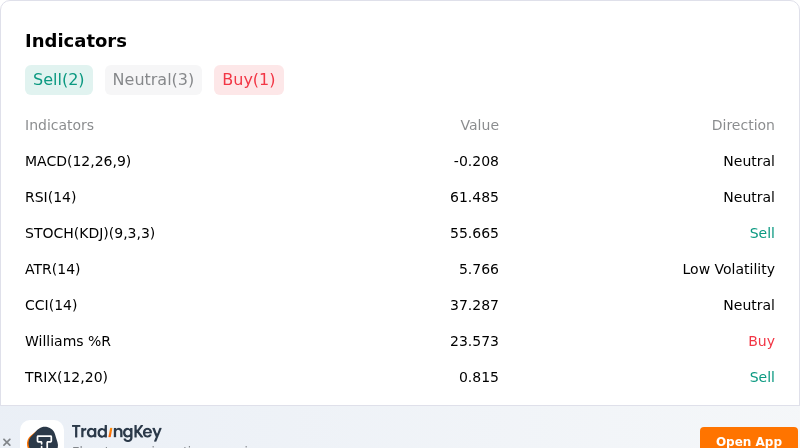
Technically, Solana (SOLUSD) shows a MACD (12,26,9) value of -0.208, indicating a neutral signal. The RSI at 61.485 suggests neutral condition and the Williams %R at 23.573 suggests buy condition. Please monitor closely.
More details about Solana (SOLUSD)
Recent Events and Risks:
- Deceleration in Institutional ETF Flows and Exchange Inflows: Recent institutional flow data shows a sharp slowdown in U.S. spot Solana ETF inflows down to $7.7 million following peak sessions, accompanied by net redemptions in funds like VanEck's VSOL. Additionally, on-chain fee transfers from major ecosystem protocols—such as Pump.fun moving nearly 48,000 SOL (~$5.8 million) to Kraken—have injected sudden spot supply onto centralized exchanges, weakening local order book depth.
- Over-Leveraged Long Concentration and Liquidation Risk: Perpetual futures positioning remains heavily long-skewed with a 1.79 long-to-short ratio on major trading venues and open interest holding above $1 billion. Following rejections near the $125 resistance level, price action has stalled below key pivot zones, leaving market structure exposed to forced liquidation cascades if price breaches dense long liquidation clusters between $116 and $117.
- Macro Yield Pressure and Altcoin Liquidity Drain: A macro-driven risk-off environment catalyzed by rising U.S. Treasury yields has expanded Bitcoin market dominance to 58.3%, draining liquidity away from high-beta altcoins. Lower-timeframe Solana charts exhibit bearish momentum divergences and breakdowns below recent ascending trendlines, increasing intraday downside volatility toward deeper support levels at $112.50.
- Protocol MEV Exposure and Infrastructure Vulnerability Concerns: Ecosystem research published by Jupiter highlighted Solana's disproportionately high exposure to MEV sandwich attacks relative to EVM-compatible networks. Furthermore, the launch of the STRIDE security initiative underscored remaining security posture gaps across mainnet projects, keeping institutional allocators cautious regarding protocol and validator-level operational risks.
Recommended Articles


