


BNB (BNBUSD) Is up 1.00% on Sep 30: What Do On-Chain Data and Market Sentiment Show?
BNB (BNBUSD) is up 1.00% at Sep 30 05:45(ET), now at $763.6, with a 7-day up of 0.03%.
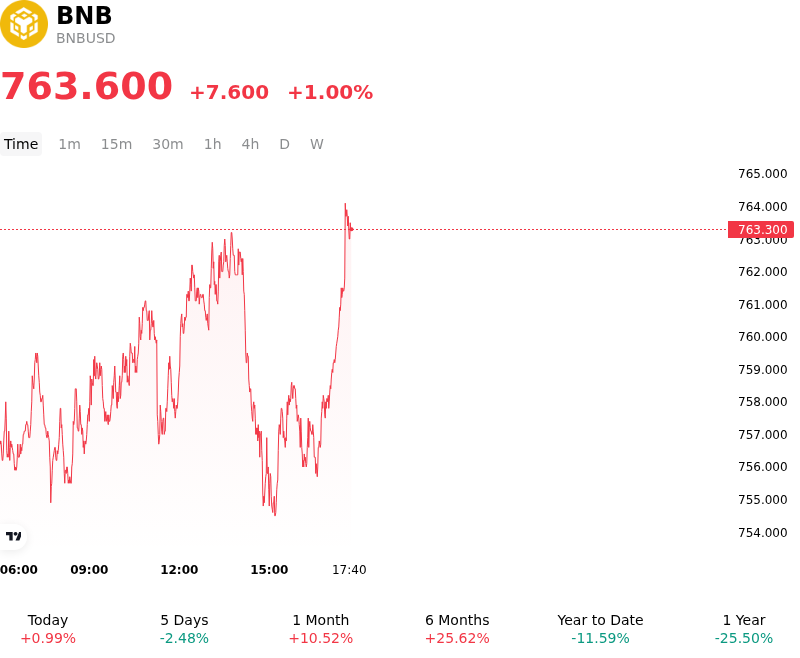
What is driving BNB (BNBUSD)’s stock price up today?
Capital flowed into BNB as investor sentiment was bolstered by accelerating institutional integration and regulatory momentum surrounding tokenized real-world assets. The regulatory environment turned increasingly constructive following market exemption rulings for on-chain stock trading, which recognized major high-throughput networks including BNB Chain as key infrastructure for tokenized asset settlement. This structural tailwind was reinforced by institutional product positioning, notably benchmark asset management funds assigning BNB a dominant allocation weight exceeding 30 percent in smart contract investment vehicles, opening a regulated channel for institutional capital entry.
Intraday liquidity conditions and trading demand were further energized by expanding exchange utility, highlighted by new additions of tokenized equities as eligible collateral across portfolio and cross-margin trading accounts. This ongoing enhancement of token utility directly incentivizes institutional desks and market makers to maintain native spot balances to optimize collateral efficiency and trading fee structures. Concurrently, technical throughput upgrades across the BNB Chain network—such as validator gas limit increases and reduced block finality times—have driven sustained transaction growth across decentralized trading venues, real-world asset issuance, and automated AI payment abstractions.
In derivatives and spot markets, expanding product availability, including perpetual futures on external regulatory-compliant venues, has enhanced liquidity depth and enabled more sophisticated hedging strategies. From a market structure standpoint, BNB maintained firm buyer interest around key technical support levels, prompting short covering and momentum buying toward major overhead resistance thresholds. While global macroeconomic liquidity trends and broader regulatory scrutiny across crypto-native exchanges remain ongoing risk factors for institutional investors to monitor, the convergence of expanding ecosystem utility, regulated fund inflows, and high on-chain settlement volume continues to bolster market confidence.
Technical Analysis of BNB (BNBUSD)
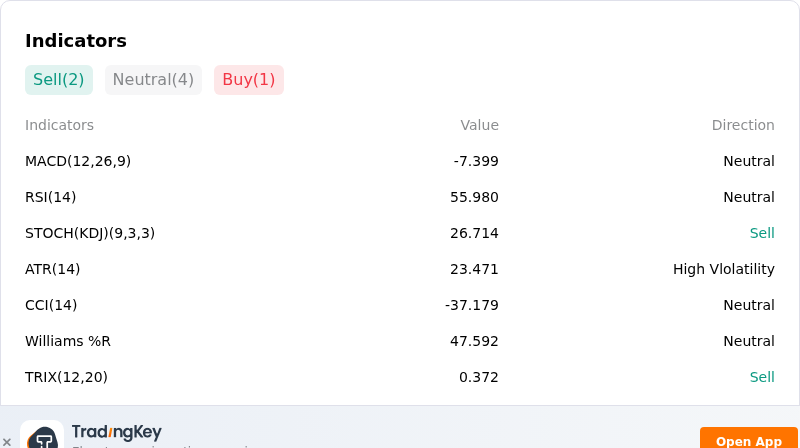
Technically, BNB (BNBUSD) shows a MACD (12,26,9) value of -7.399, indicating a neutral signal. The RSI at 55.980 suggests neutral condition and the Williams %R at 47.592 suggests neutral condition. Please monitor closely.
More details about BNB (BNBUSD)
Recent Events and Risks:
- Renewed Sanctions Scrutiny and Enforcement Overhang: A U.S. Department of Justice investigation seeking the forfeiture of $61 million in crypto funds tied to illicit Iranian transactions laundered through Binance accounts has reignited regulatory anxiety, raising market concerns regarding compliance under previous federal settlement terms.
- Resistance Rejection and Long Liquidation Exposure: BNB experienced a sharp technical rejection near the $800 psychological resistance level, driving a wave of derivative long unwinding and leaving concentrated position clusters vulnerable to forced liquidations toward lower support levels.
- On-Chain Fee Compression and Reduced Burn Rate: Decentralized trading activity across the BNB Chain has softened, marked by notable single-day drops in protocol fees on key platforms like PancakeSwap, which directly lowers gas usage and slows down the token's automated burn velocity.
- Altcoin Liquidity Drain and Regulatory Headwinds: High Bitcoin market dominance combined with firming U.S. Treasury yields is accelerating capital rotation out of major altcoins, while ongoing compliance hurdles under Europe's MiCA regulatory framework continue to suppress institutional risk appetite.
Recommended Articles


