

Cardano Price Forecast: ADA Selling Pressure Builds, Putting $0.27 Back in Focus

- Iran Situation Rekindles Threat of War. Bitcoin Price Decline Accelerates, $75,000 Geopolitical Defense Line Faces Test
- WTI declines below $102.00 after Trump says he called off Iran attacks
- Gold falls below $4,500 on rising global rate hike bets
- Nvidia Earnings Approach: Can It Drive a Nasdaq Rebound? What Should Investors Watch Most?
- Euro softens to near 1.1600 on US–Iran tensions
- Australian Dollar softens to near 0.7200 as Trump and Xi set for second day of talks

Cardano is trading around $0.34 on Monday after three straight weeks of declines since early January.
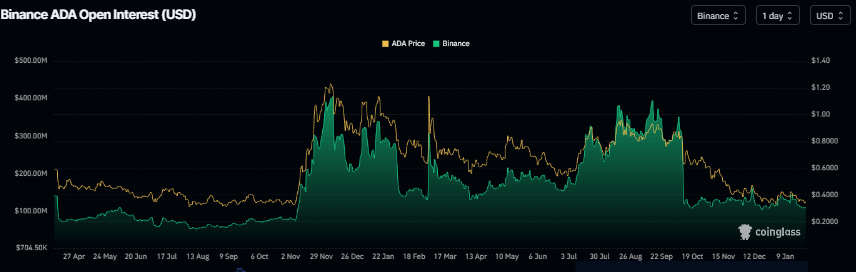
Futures positioning is thinning out, with Binance open interest sliding to $108.55 million, the lowest since December 25, according to Coinglass.
With momentum indicators still bearish and key levels overhead, the chart leaves room for a deeper drop toward $0.27 if support gives way.
Cardano (ADA) was hovering near $0.34 at the time of writing on Monday, extending a pullback that has now lasted three consecutive weeks since early January. Both derivatives activity and price structure point to a market where sellers still have the upper hand. A continued loss of participation would keep downside risks elevated and leaves $0.27 as a visible next target if the decline accelerates.
Open interest drops, signaling weaker participation
Derivatives data is aligning with the soft price action. Cardano’s futures Open Interest on Binance fell to $108.55 million on Sunday, marking its lowest reading since December 25, based on Coinglass data. Lower OI often reflects traders stepping back, and in a downtrend that can reinforce the bearish setup because there is less fresh risk appetite to absorb selling.
ADA rejected at the 50-day EMA and broke $0.38 support
From a technical perspective, ADA’s latest leg lower began after it was rejected at the 50-day EMA ($0.39) on January 14. Over the next four days, price dropped nearly 10% and finished below the daily support at $0.38. The slide continued last week, with ADA down more than 9%. As of Monday, it is still trading around $0.34.
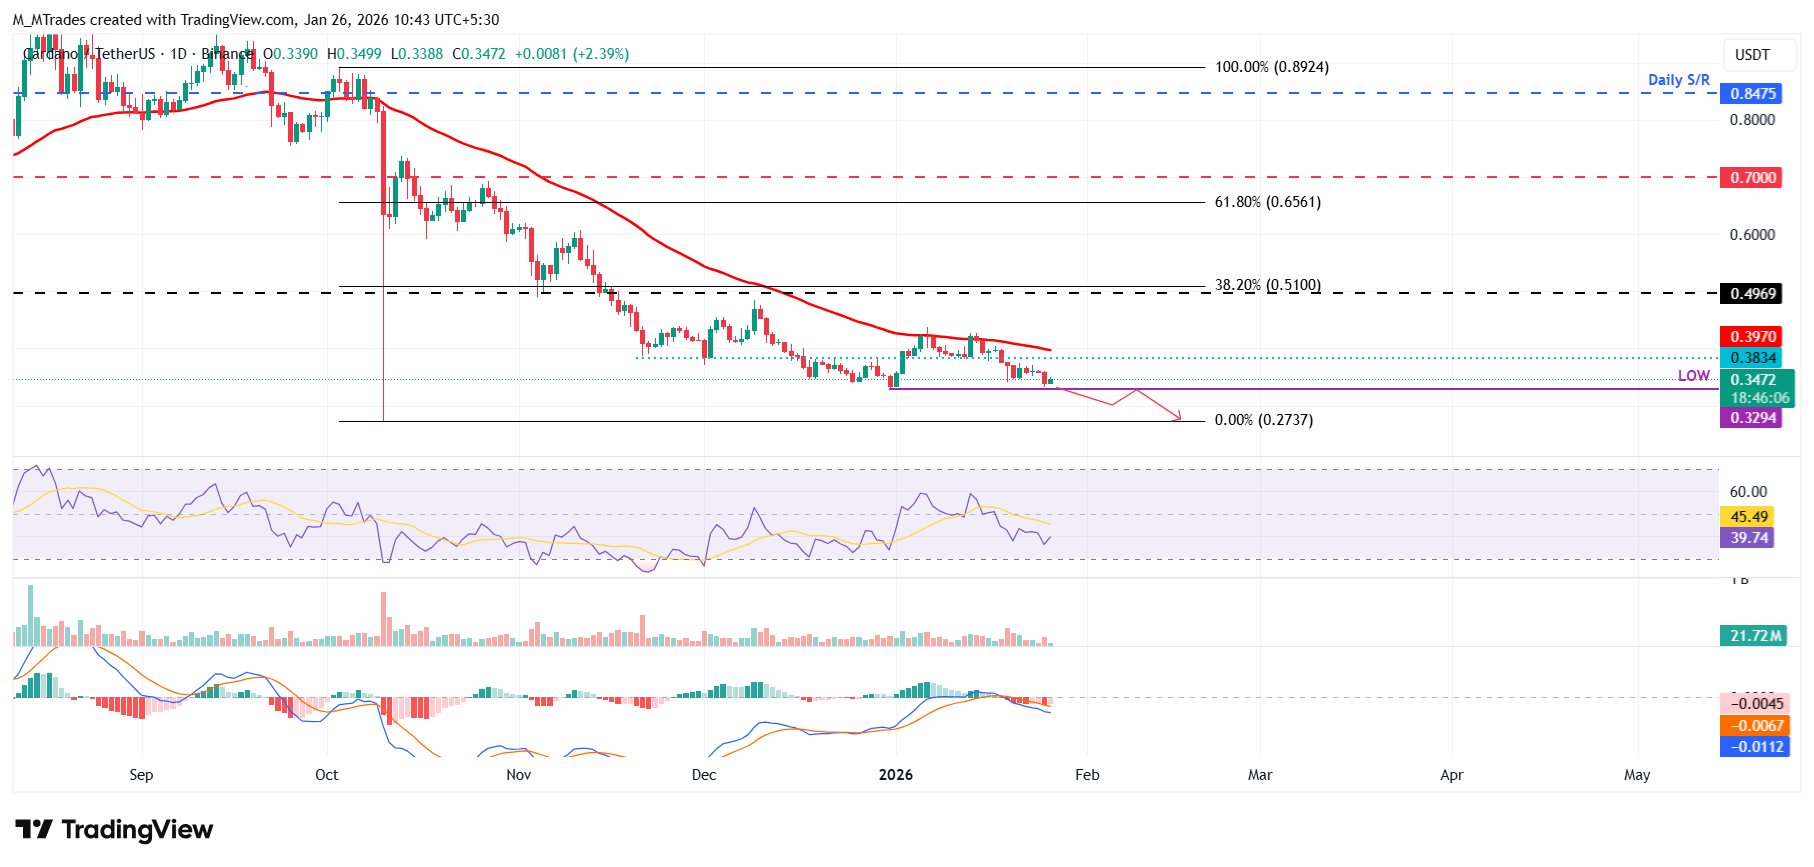
If the correction extends, the first level to watch is the December 31 low at $0.32. A daily close below $0.32 would put the October 10 low at $0.27 in play.
Momentum indicators remain tilted to the downside. The daily RSI is 39, well below the neutral 50 level, which suggests bearish momentum is still strengthening. The MACD also remains negative after a bearish crossover on January 18, with rising red histogram bars below the neutral line reinforcing the downward bias.
If ADA manages a recovery instead, the key test is whether price can work back toward the former daily support area at $0.38, which is now the first level that would need to be reclaimed to ease immediate downside pressure.
Read more
The above content was completed with the assistance of AI and has been reviewed by an editor.


