

Avalanche Price Forecast: AVAX set to extend losses as Open Interest drops to one-month low

- Iran Situation Rekindles Threat of War. Bitcoin Price Decline Accelerates, $75,000 Geopolitical Defense Line Faces Test
- WTI declines below $102.00 after Trump says he called off Iran attacks
- Gold falls below $4,500 on rising global rate hike bets
- Nvidia Earnings Approach: Can It Drive a Nasdaq Rebound? What Should Investors Watch Most?
- Euro softens to near 1.1600 on US–Iran tensions
- Australian Dollar softens to near 0.7200 as Trump and Xi set for second day of talks

Avalanche edges higher on Wednesday after hitting a two-month low on Tuesday.
Optimism in AVAX derivatives fades as Open Interest hits a 30-day low.
The technical outlook indicates increased downside risks for Avalanche as it could break down from key support.
Avalanche (AVAX) trades in the green by almost 1% at press time on Wednesday, as it tests a crucial support floor that has held for over two months. The near-term outlook for the altcoin isn't promising, as Open Interest in the derivatives market has dropped to a 30-day low, and the technical outlook points to a steeper correction towards its year-to-date low.
Bearish sentiment sparks in AVAX derivatives markets
Coinglass’ data shows the AVAX Open Interest (OI) dropped to $441 million, a decline of over 3% in the last 24 hours. This marks the lowest value in 30 days, suggesting a continued capital outflow from AVAX derivatives as buying activity declines.
Amid waning optimism, $1.40 million in longs were liquidated over 24 hours compared to $86K in short liquidations, suggesting a significant wipeout of bullish positions.
This aligns with the pullback in AVAX and drops the long-short ratio to 0.9451, signaling a greater number of active bearish positions.
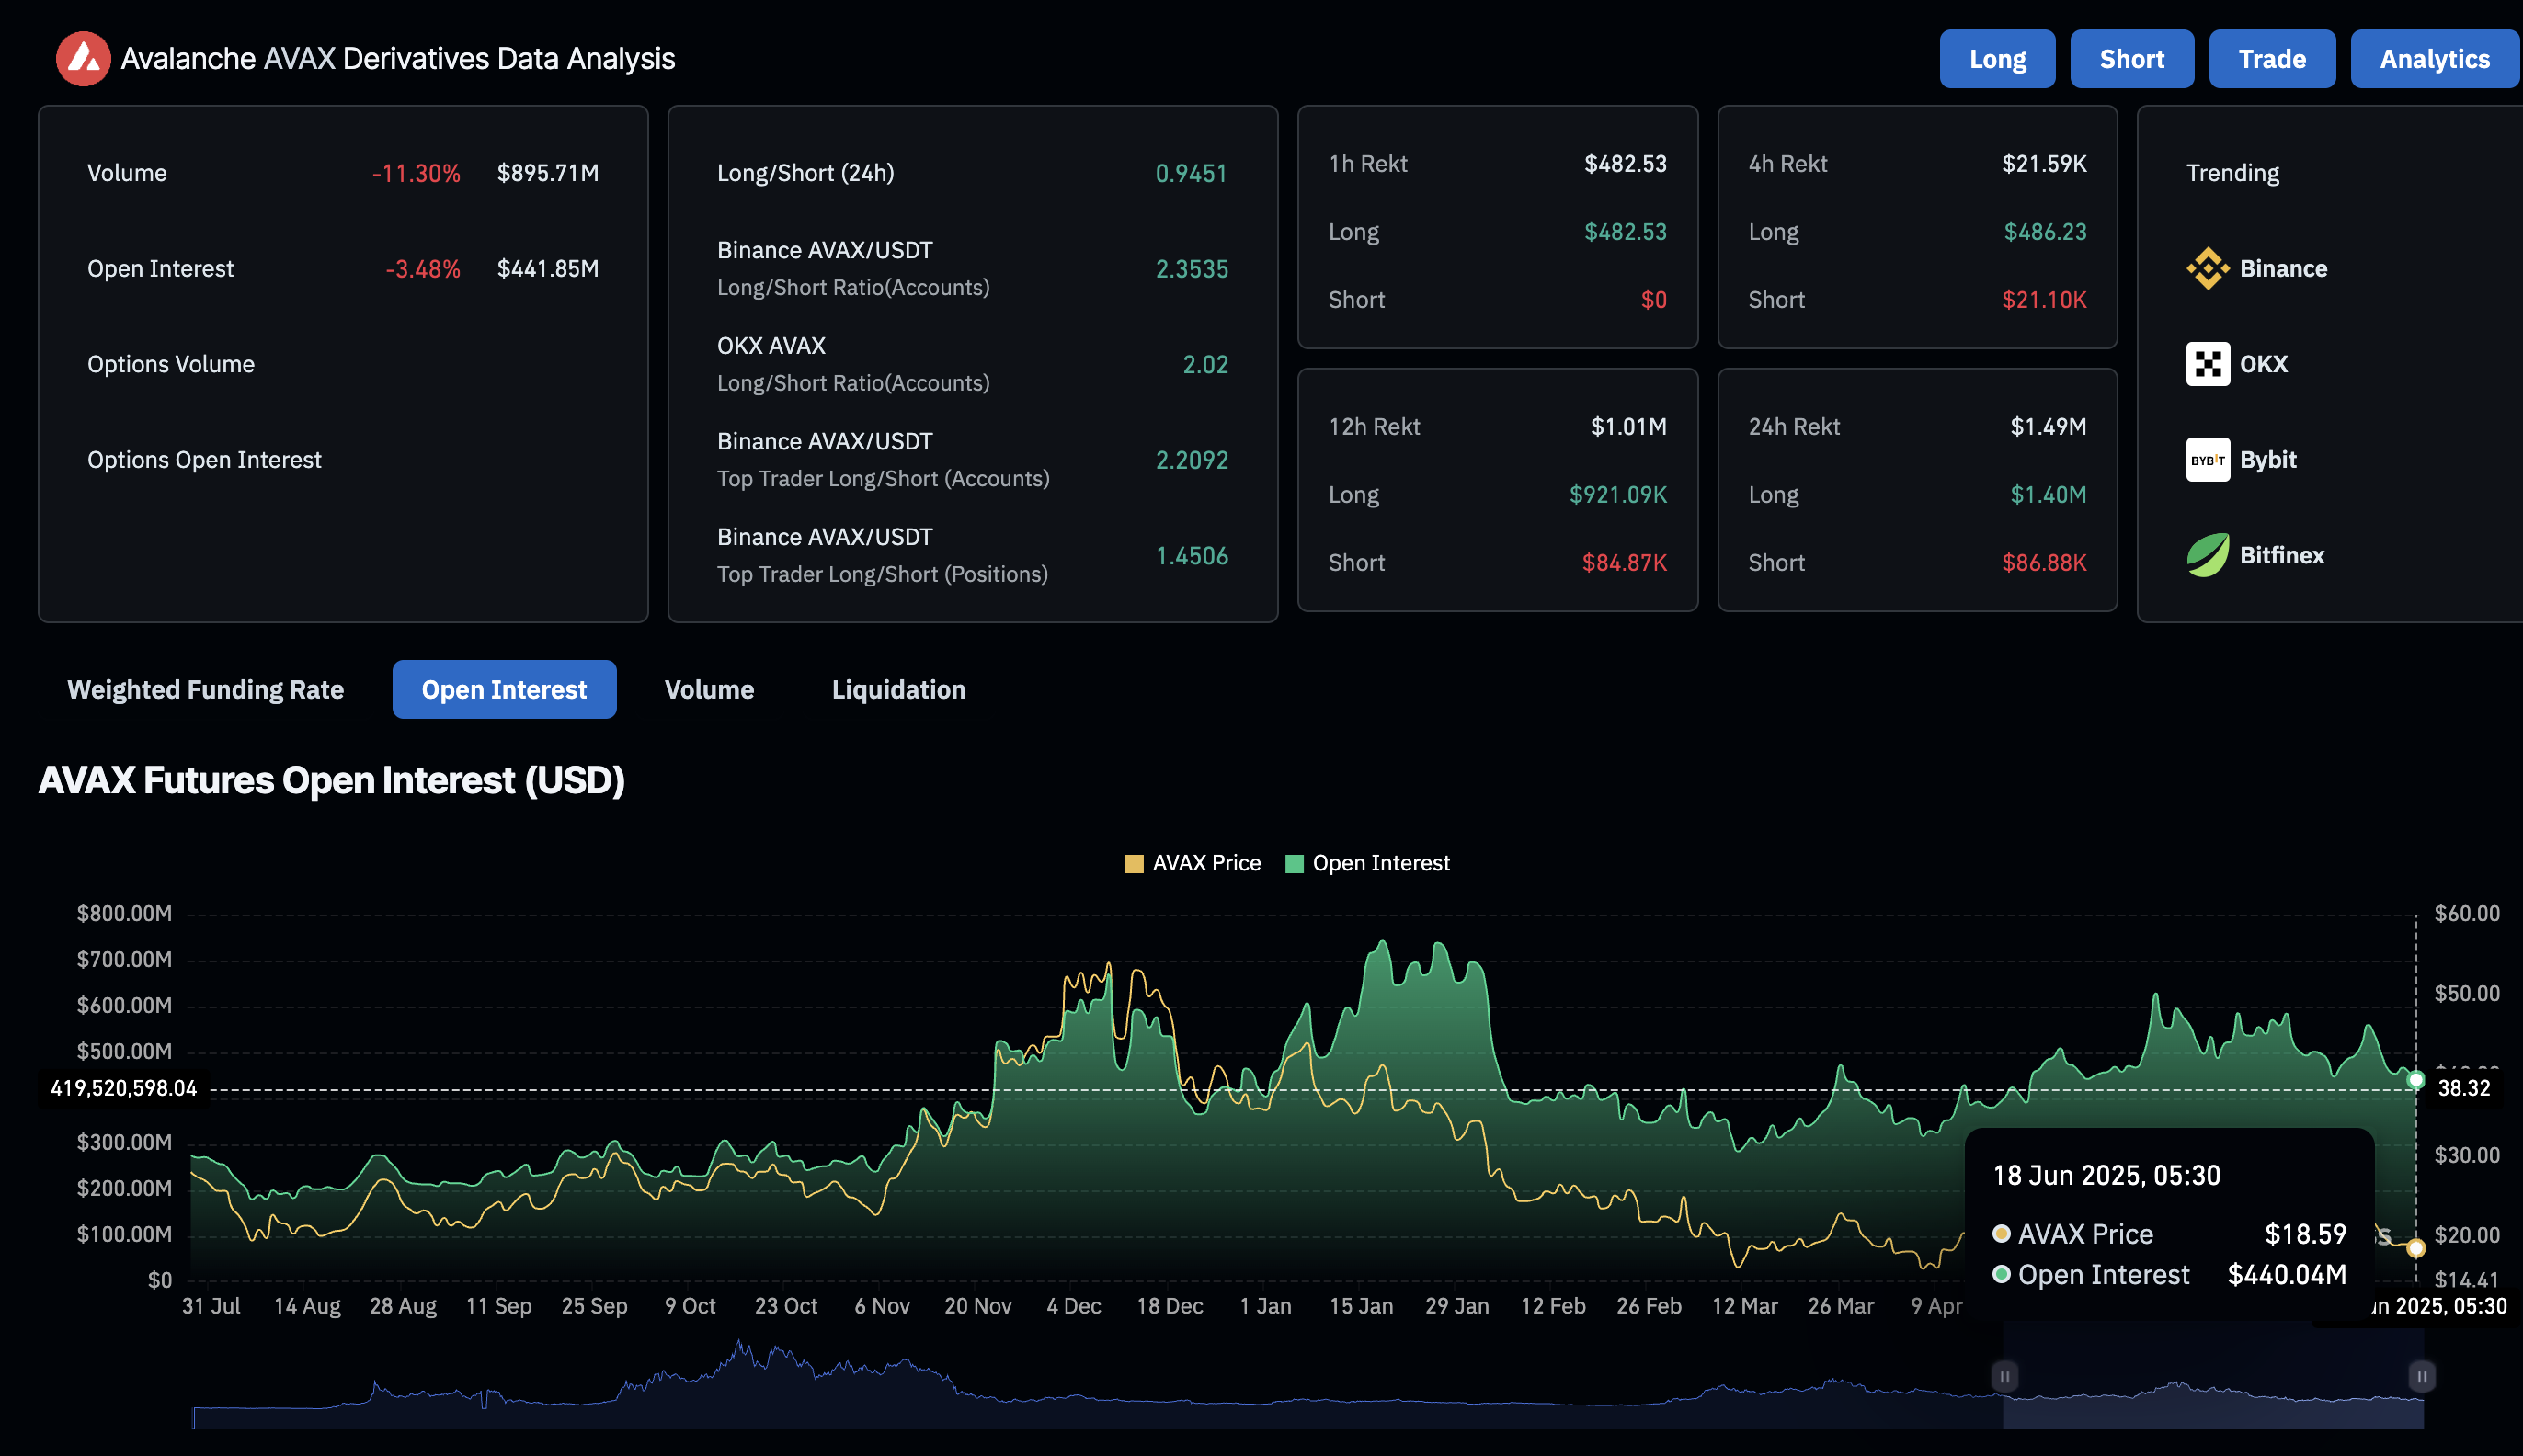
Avalanche derivatives. Source: Coinglass
The OI-weighted funding rate fluctuates near the zero line as sentiment among traders shifts. However, the data show an OI-weighted funding rate of 0.0022% as buying activity gains traction in the short term.
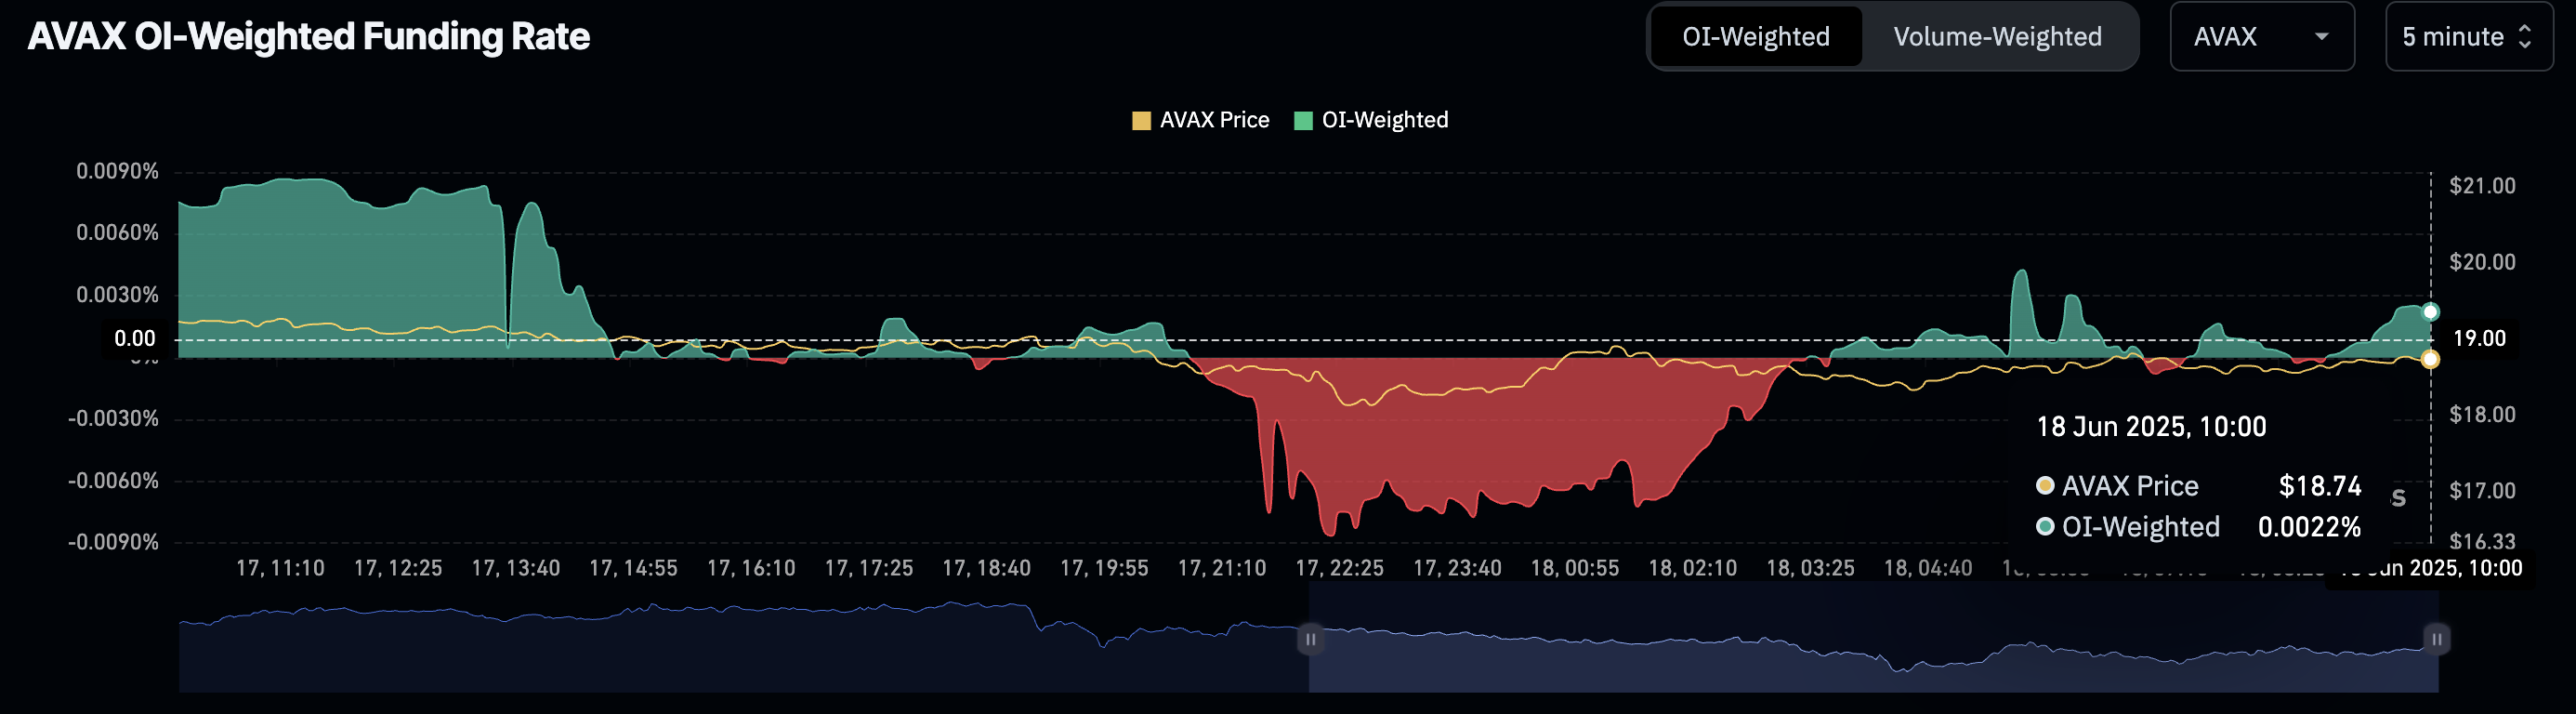
AVAX OI-weighted funding rate. Source: Coinglass
An apparent bearish inclination is visible in Avalanche derivatives as selling pressure grows.
Avalanche eyes drop to $16
Avalanche holds above the $18.50 support marked by the April 16 low, recovering slightly from the $18.13 low posted on Tuesday. The AVAX price action reveals overhead pressure, with a couple of long wicked candles this week.
Avalanche could extend its losses towards $16.14 support if it closes below the $18.50 floor, followed by the year-to-date low of $14.66.
The momentum indicators maintain a bearish bias on the daily chart as selling pressure grows. The Moving Average Convergence/Divergence (MACD) indicator fails to cross above its signal line, prolonging the declining trend. With rising red histograms below the zero line, the indicator suggests a surge in selling activity.
The Relative Strength Index (RSI) at 38 is slightly above the oversold boundary, way below the halfway line. With still room on the downside, the indicator aligns with the breakdown possibility.
Typically, in oversold conditions, bullish reversal chances are heightened. However, a potential consolidation in the oversold zone could prolong AVAX’s correction.
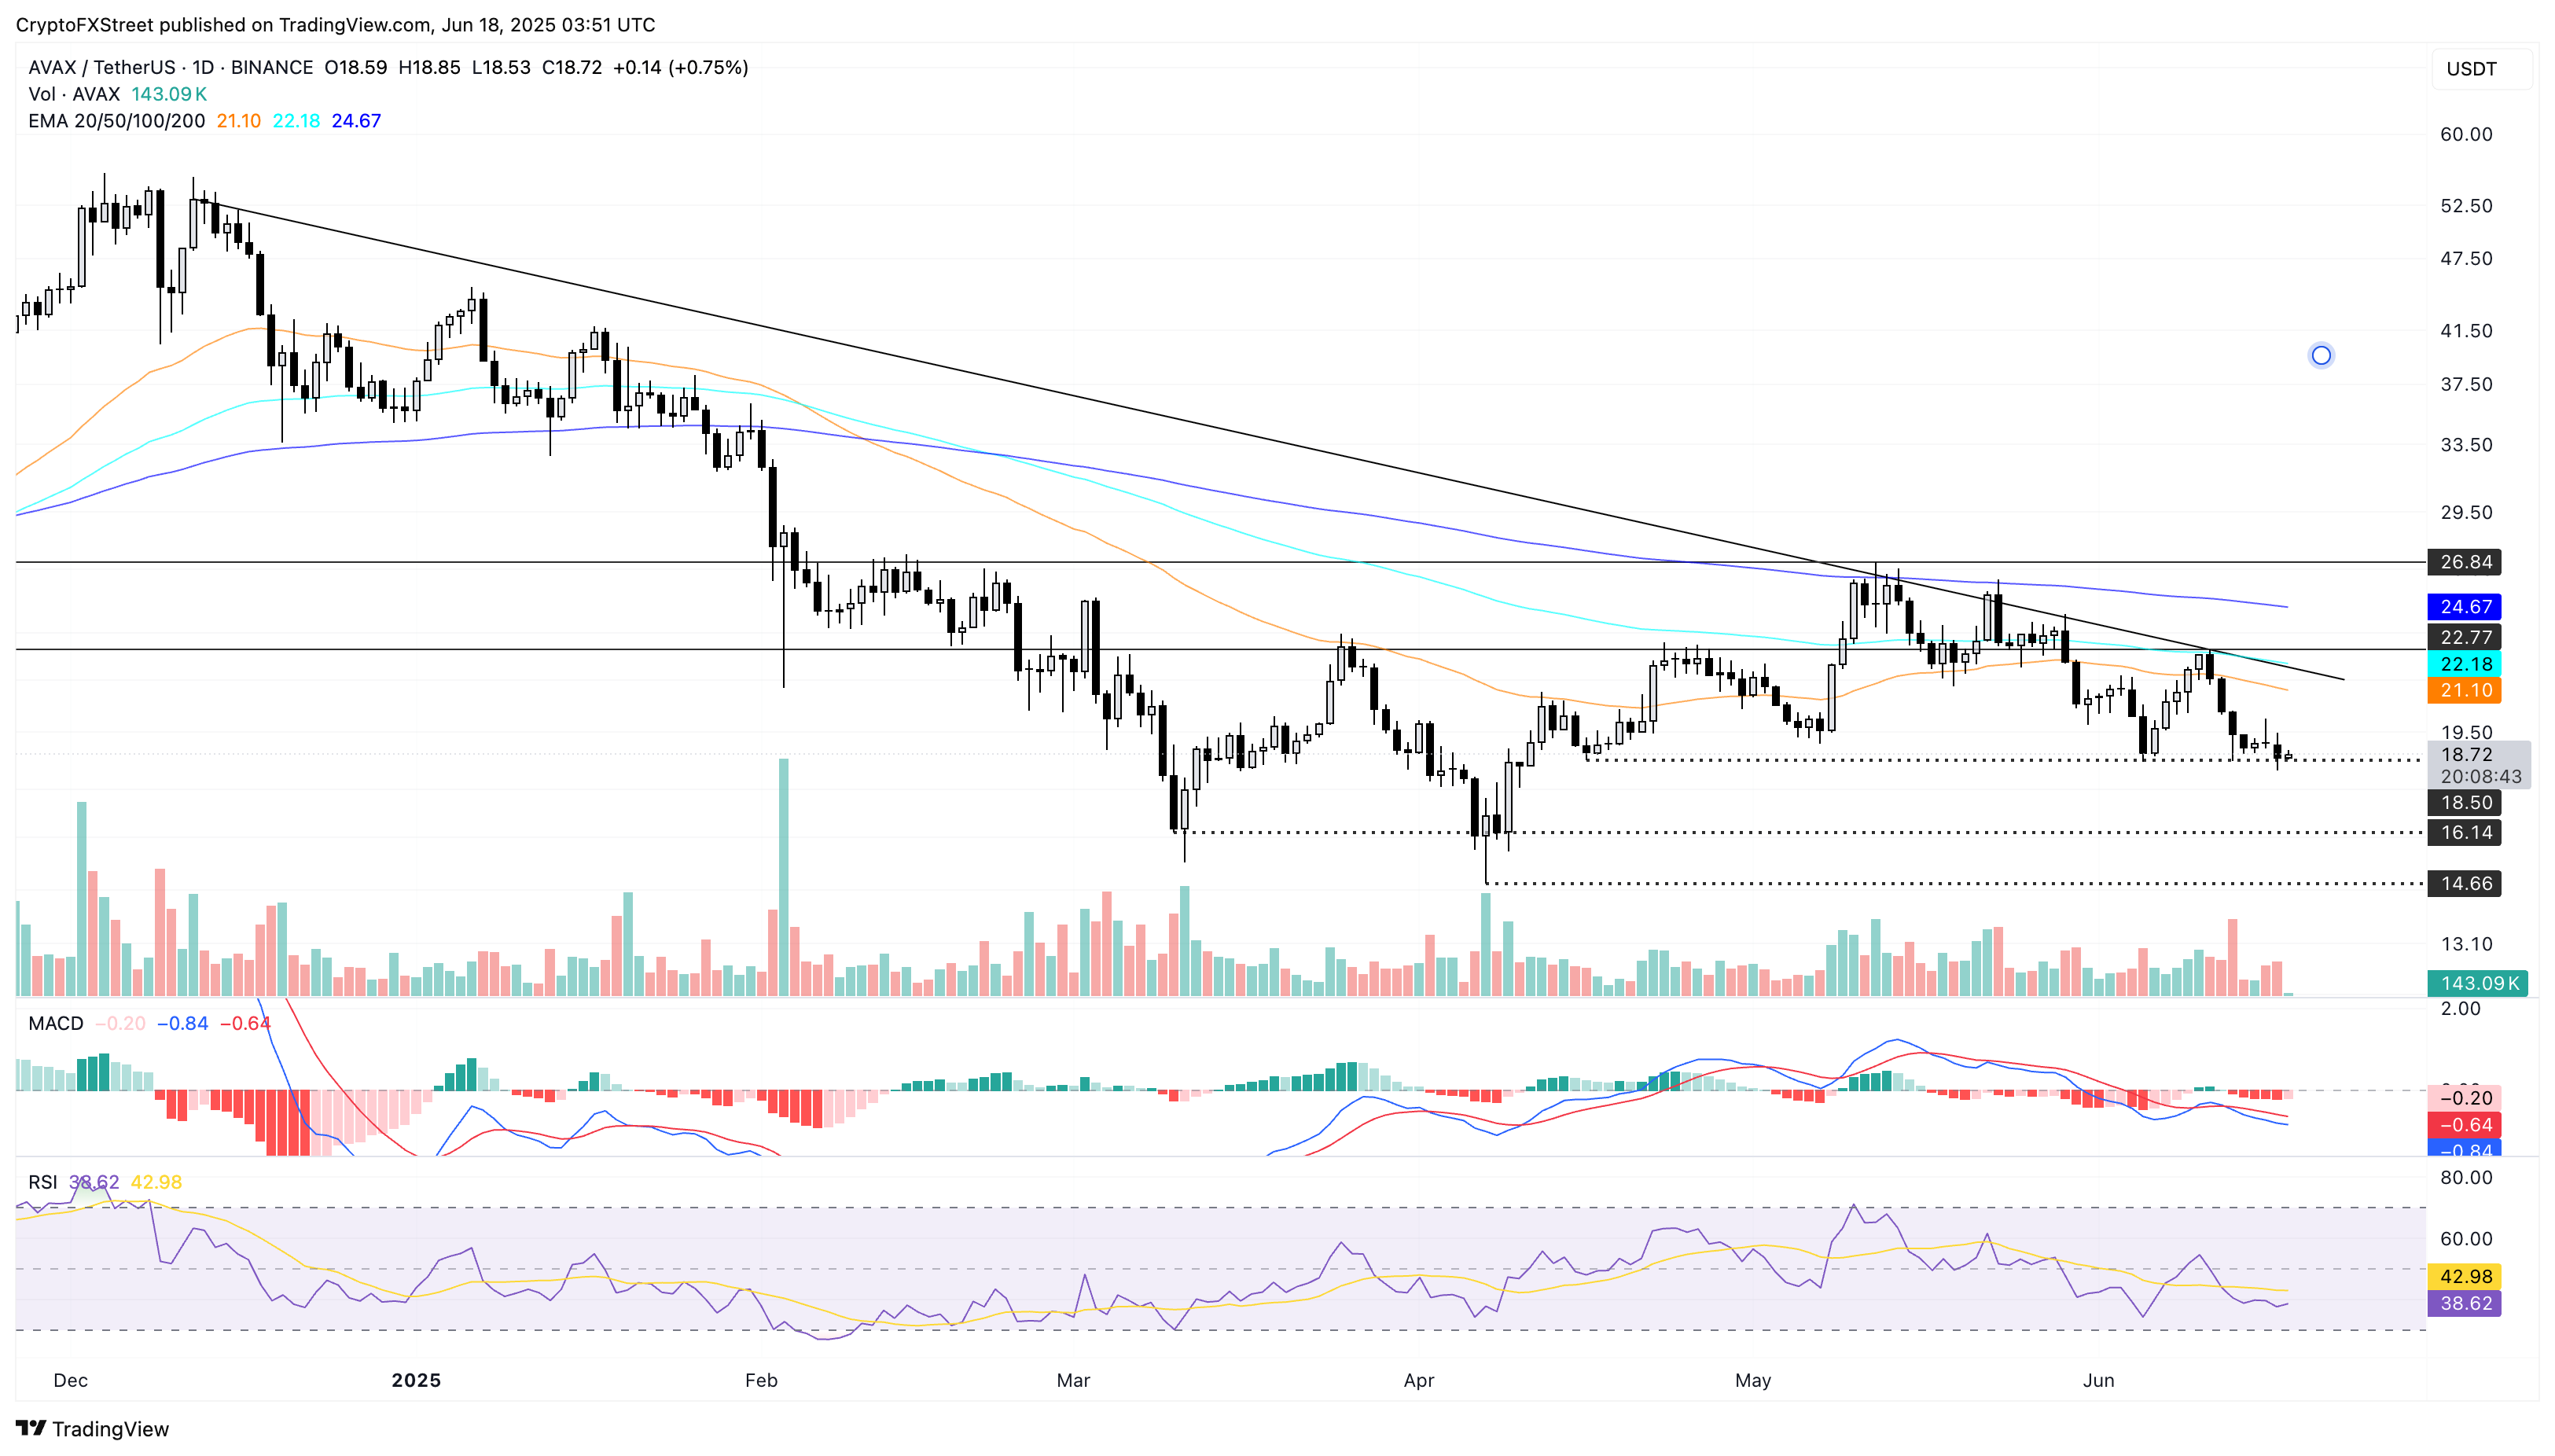
AVAX/USDT daily price chart.
Suppose Avalanche bounces off the $18.50 support level if the broader market stabilizes. It could propel AVAX towards the 50-day Exponential Moving Average (EMA) at $21.11.
Read more
* The content presented above, whether from a third party or not, is considered as general advice only. This article should not be construed as containing investment advice, investment recommendations, an offer of or solicitation for any transactions in financial instruments.


