Cardano Price Forecast: ADA finds support as network growth fuels bullish outlook

Mitrade
coverImg
Source: DepositPhotos
  • Cardano price finds support around the previous broken trendline, signaling an upside move ahead.   

  • Everstake is now an official Cardano DRep, highlighting the growing expansion of the ADA network.

  • Derivatives data support a recovery with positive funding rate and rising bullish bets.

Cardano (ADA) shows signs of recovery, trading around $0.85 on Friday after finding support around its previously broken trendline earlier this week. Everstake becomes an official Cardano Delegated Representative (DRep) on Thursday, showing Cardano’s governance expansion. Moreover, positive funding rates and rising bullish bets further strengthen the case for a sustained rebound.

Cardano’s governance continues to expand

Cardano announced on Thursday that Everstake is the official Cardano DRep (Delegated Representative). 

“We’re excited to play an active role in Cardano’s on-chain governance and help shape the future of one of the most decentralized ecosystems in crypto,” said Everstake X post.

As a DRep, Everstake has a direct voice in Cardano’s governance, voting on critical proposals, protocol upgrades, and community initiatives on behalf of ADA holders, thereby highlighting Cardano’s growing network expansion.

https://twitter.com/Cardano_CF/status/1961021780237140049

Derivatives data show signs of a recovery

Coinglass’s OI-Weighted Funding Rate data shows that the number of traders betting that the price of Cardano will slide further is lower than those anticipating a price increase.

The metric has flipped a positive rate on Tuesday and rose to 0.0070% on Friday, indicating that longs are paying shorts. Historically, as shown in the chart below, when the funding rates have flipped from negative to positive, Cardano’s price has rallied sharply.
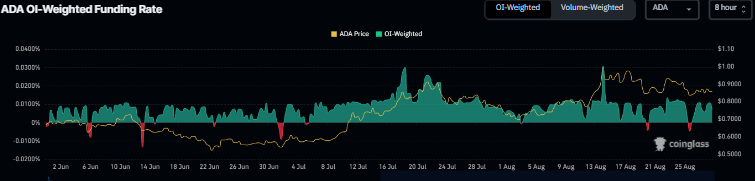
Cardano’s funding rate chart. Source: Coinglass

Cardano’s funding rate chart. Source: Coinglass

Apart from positive funding rates, Cardano’s long-to-short data also shows a rise in bullish bets among traders, further supporting the recovery view.
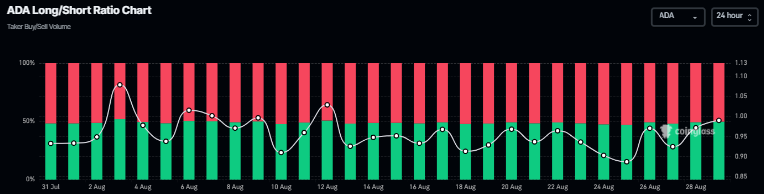
ADA long-to-short ratio chart. Source: Coinglass

ADA long-to-short ratio chart. Source: Coinglass

Cardano Price Forecast: ADA steadies around key support zone

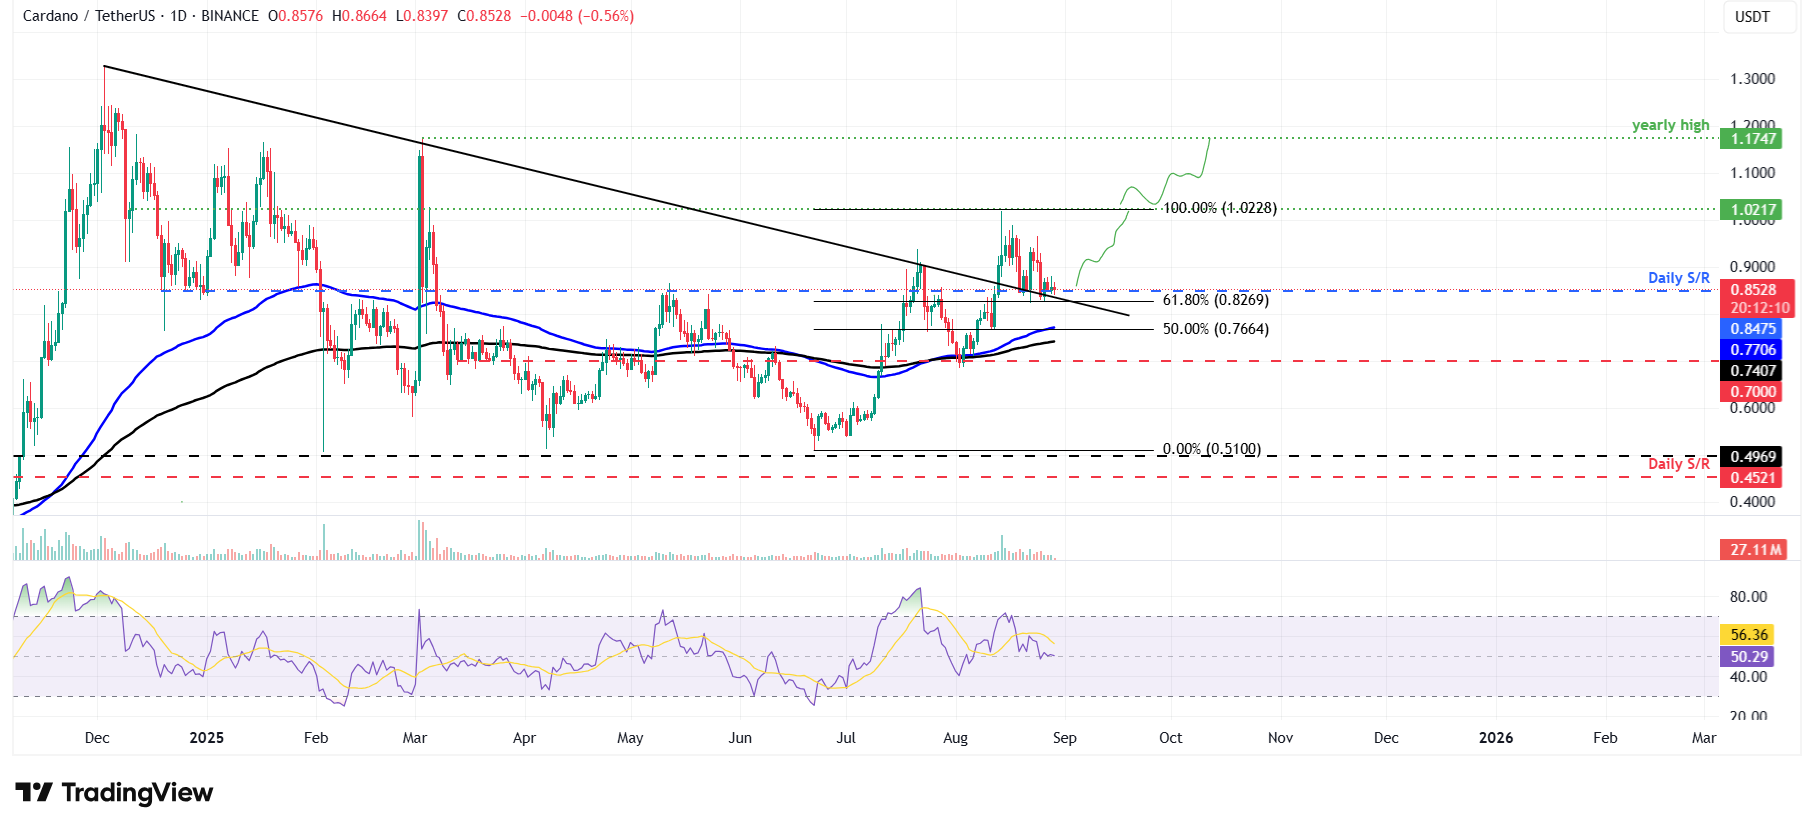
Cardano price retested the previously broken trendline, which roughly coincides with the 61.8% Fibonacci retracement level at $0.82 on August 22, and rallied by over 9%. However, ADA failed to sustain the upward momentum and declined 7% so far this week, steadying around the $0.82 support zone. At the time of writing on Friday, it hovers at around $0.85.

If the $0.82 continues to hold as support and ADA recovers, it could extend the rally toward its August 14 high of $1.02. 

The Relative Strength Index (RSI) on the daily chart is hovering around its neutral level of 50, indicating indecision among traders. For the recovery rally to be sustained, the RSI must move above its neutral level.
ADA/USDT daily chart 

ADA/USDT daily chart 

However, if ADA closes below the $0.82 support level on a daily basis, it could extend the correction toward its next support level at $0.76, which is the 50% price retracement.

Read more

  • Gold Price Forecast: XAU/USD regains ground below $3,700, outlook remains fragile
  • Gold Hits Near 1.5-Year Low Below $3,800 as Bears Threaten Drop to $3,500
  • Australian Dollar falls below 0.6700 as Unemployment Rate jumps to the highest level in five years
  • * The content presented above, whether from a third party or not, is considered as general advice only.  This article should not be construed as containing investment advice, investment recommendations, an offer of or solicitation for any transactions in financial instruments.

    goTop
    quote
    Related Articles
    placeholder
    Nvidia posts record $115.8B Q3 revenue, but crypto stays mutedThe crypto market remained subdued on Tuesday despite Nvidia's (NVDA) Q3 earnings release beating analysts' expectations as demand for artificial intelligence infrastructure continued to drive growth across its business.
    Author  FXStreet
    Nov 18, Wed
    The crypto market remained subdued on Tuesday despite Nvidia's (NVDA) Q3 earnings release beating analysts' expectations as demand for artificial intelligence infrastructure continued to drive growth across its business.
    placeholder
    Ethereum Drops Below $2,000 After Plunging Over 20% in a Month as Odds of $1,500 Retest SurgeEthereum Plunges Over 20% in a Month, Risking a Retest of $1,500 After Losing the $2,000 Defense Line.On November 13, Ethereum (ETH) plunged more than 5%, officially falling below the key
    Author  TradingKey
    Nov 13, Fri
    Ethereum Plunges Over 20% in a Month, Risking a Retest of $1,500 After Losing the $2,000 Defense Line.On November 13, Ethereum (ETH) plunged more than 5%, officially falling below the key
    placeholder
    Bitcoin lost its 200-day average — but the exit started three sessions before the CPIBitcoin fell 2.5% to about $73,400 on 11 November, an 11-week low, breaking its 200-day moving average near $73,100. The 24-hour liquidation tally reached $632 to $705 million, roughly 82% of it longs. But spot ETF outflows began three sessions earlier and USDT's market cap has shrunk $6.6 billion in 60 days — the leveraged length left before the inflation print did. A double top at 81,890 and 81,080 leaves a measured target of 69,366.
    Author  Suzie
    Nov 11, Wed
    Bitcoin fell 2.5% to about $73,400 on 11 November, an 11-week low, breaking its 200-day moving average near $73,100. The 24-hour liquidation tally reached $632 to $705 million, roughly 82% of it longs. But spot ETF outflows began three sessions earlier and USDT's market cap has shrunk $6.6 billion in 60 days — the leveraged length left before the inflation print did. A double top at 81,890 and 81,080 leaves a measured target of 69,366.
    placeholder
    Bitcoin Price Forecast: BTC faces pressure as weekly ETF outflows hit $1.28 billionBitcoin (BTC) remains under pressure on Monday, trading below the 50-week Simple Moving Average (SMA) at $75,222 after extending its losing streak to five consecutive weeks.
    Author  FXStreet
    Nov 09, Mon
    Bitcoin (BTC) remains under pressure on Monday, trading below the 50-week Simple Moving Average (SMA) at $75,222 after extending its losing streak to five consecutive weeks.
    placeholder
    Bitcoin ETFs sold $1.28 billion in a week — and BTC is still above 75,000US spot Bitcoin ETFs logged $1.28 billion of net outflows in the week to Nov 6, the largest since late June, with BlackRock's IBIT accounting for $1.21 billion. Yet BTC only fell from $80,405 to $74,940, a 6.8% move. The gap between the fund flow and the price is the story: leveraged longs were flushed, but spot holders did not follow the ETFs out — and $75,000 is the line that decides whether that reading holds.
    Author  Suzie
    Nov 09, Mon
    US spot Bitcoin ETFs logged $1.28 billion of net outflows in the week to Nov 6, the largest since late June, with BlackRock's IBIT accounting for $1.21 billion. Yet BTC only fell from $80,405 to $74,940, a 6.8% move. The gap between the fund flow and the price is the story: leveraged longs were flushed, but spot holders did not follow the ETFs out — and $75,000 is the line that decides whether that reading holds.
    Live Quotes
    Name / SymbolChart% Change / Price
    ADAUSD
    ADAUSD
    0.00%0.00

    cryptocurrency Related Articles

    • Top 3 Price Prediction: Bitcoin, Ethereum, Ripple — Bulls take the reins, with $100K BTC, $3,500 ETH and $2.35 XRP in focus
    • Best Strategies When BTC Price Drops: From Hedging to Accumulating
    • How to Day Trade Crypto? Simplest Day Trading Strategy Ever
    • Trading Chart Patterns:Ultimate Guide to Price Action
    • Places that Provide Cheapest Ways to Buy Bitcoin In 2025
    • 10 Best Crypto With Most Potential to Buy and invest in 2025 - Top Picks from Expert Traders

    Click to view more