

Ethereum Price Slides Below $4,000 Support As Sellers Tighten Their Grip

- Iran Situation Rekindles Threat of War. Bitcoin Price Decline Accelerates, $75,000 Geopolitical Defense Line Faces Test
- WTI declines below $102.00 after Trump says he called off Iran attacks
- Gold falls below $4,500 on rising global rate hike bets
- Nvidia Earnings Approach: Can It Drive a Nasdaq Rebound? What Should Investors Watch Most?
- Euro softens to near 1.1600 on US–Iran tensions
- Australian Dollar softens to near 0.7200 as Trump and Xi set for second day of talks

Ethereum price struggled to stay above $4,020 and dipped further. ETH is now consolidating in a range and might decline further if there is a move below $3,820.
Ethereum started a fresh decline below $4,020 and $4,000.
The price is trading below $4,000 and the 100-hourly Simple Moving Average.
There is a key bearish trend line forming with resistance at $4,070 on the hourly chart of ETH/USD (data feed via Kraken).
The pair could continue to move down if it trades below $3,820.
Ethereum Price Dips Below Support
Ethereum price struggled to settle above $4,120 and corrected most gains, like Bitcoin. ETH price declined below the $4,020 and $4,000 levels.
It even tested the $3,820 zone. A low was formed at $3,828 and the price is now consolidating losses. There was a minor increase toward the 23.6% Fib retracement level of the recent decline from the $4,215 swing high to the $3,828 low.
Ethereum price is now trading below $4,000 and the 100-hourly Simple Moving Average. Besides, there is a key bearish trend line forming with resistance at $4,070 on the hourly chart of ETH/USD.
On the upside, the price could face resistance near the $3,950 level. The next key resistance is near the $4,020 level and the 50% Fib retracement level of the recent decline from the $4,215 swing high to the $3,828 low. The first major resistance is near the $4,070 level and the trend line.
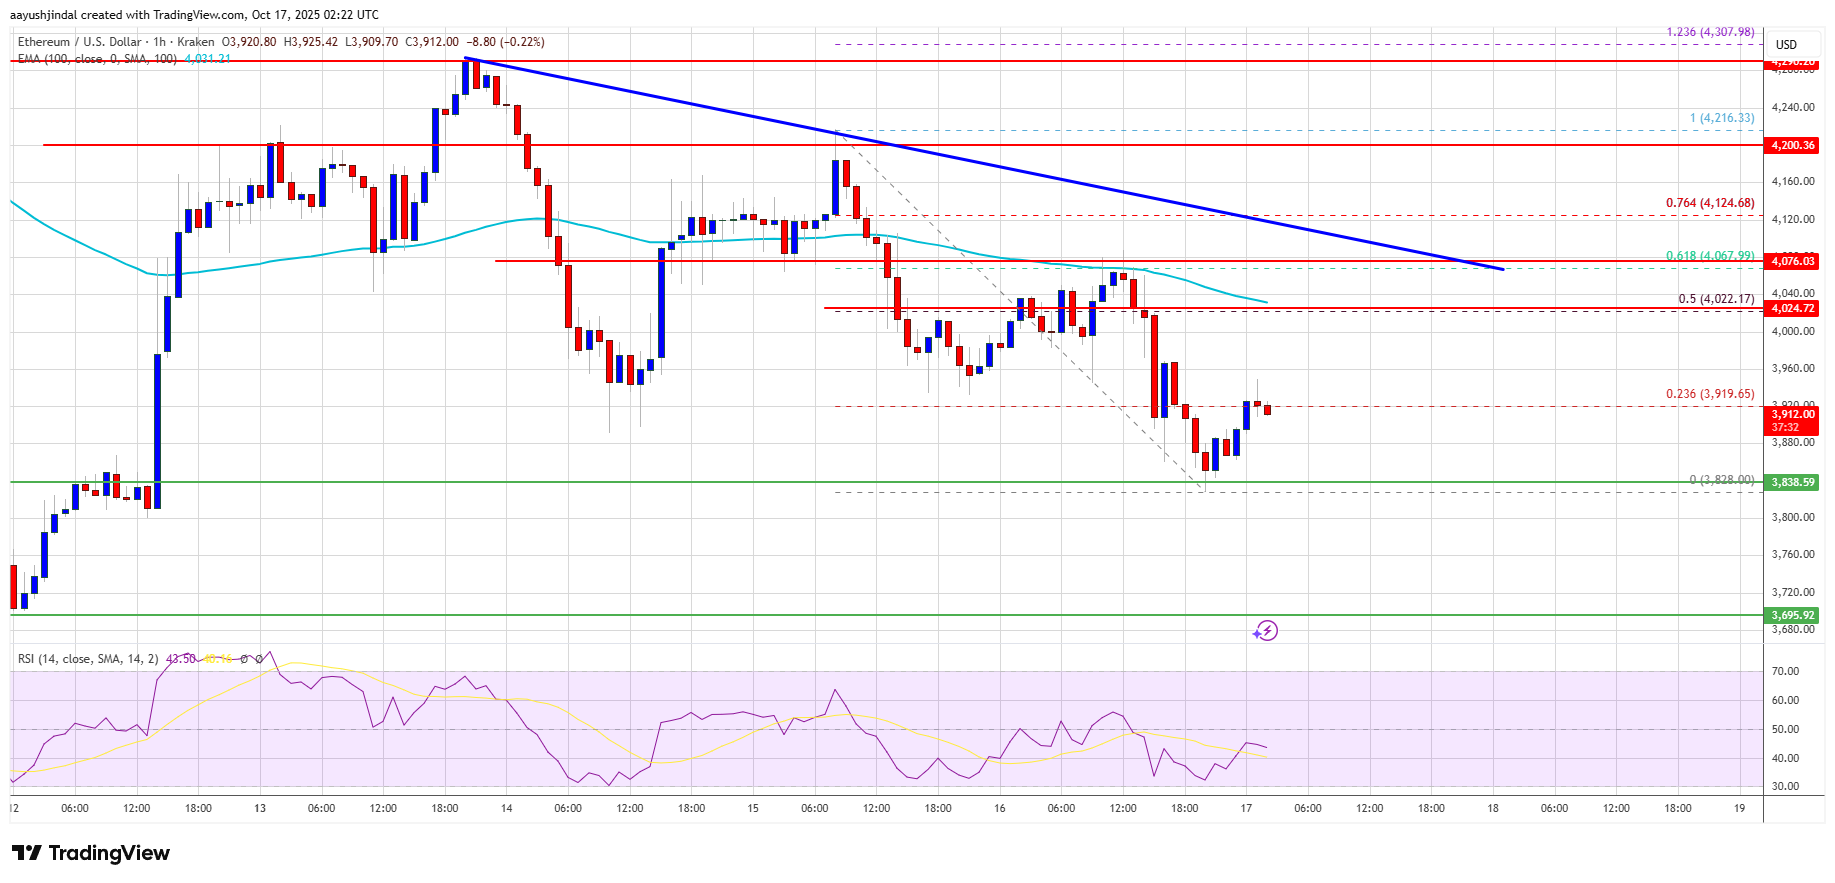
A clear move above the $4,070 resistance might send the price toward the $4,120 resistance. An upside break above the $4,120 region might call for more gains in the coming sessions. In the stated case, Ether could rise toward the $4,220 resistance zone or even $4,250 in the near term.
Another Decline In ETH?
If Ethereum fails to clear the $4,020 resistance, it could start a fresh decline. Initial support on the downside is near the $3,880 level. The first major support sits near the $3,820 zone.
A clear move below the $3,820 support might push the price toward the $3,740 support. Any more losses might send the price toward the $3,650 region in the near term. The next key support sits at $3,550.
Technical Indicators
Hourly MACD – The MACD for ETH/USD is gaining momentum in the bearish zone.
Hourly RSI – The RSI for ETH/USD is now below the 50 zone.
Major Support Level – $3,820
Major Resistance Level – $4,070
Read more
* The content presented above, whether from a third party or not, is considered as general advice only. This article should not be construed as containing investment advice, investment recommendations, an offer of or solicitation for any transactions in financial instruments.


