

Top 3 Price Prediction Bitcoin, Ethereum, Ripple: Google’s ‘Willow’ chip stirs crypto security fears

- Iran Situation Rekindles Threat of War. Bitcoin Price Decline Accelerates, $75,000 Geopolitical Defense Line Faces Test
- WTI declines below $102.00 after Trump says he called off Iran attacks
- Gold edges higher to near $4,700 as Trump-Xi summit looms
- Euro softens to near 1.1600 on US–Iran tensions
- Australian Dollar softens to near 0.7200 as Trump and Xi set for second day of talks
- Bitcoin Price Forecast: BTC battles at key technical zone amid mixed flow signals

●Bitcoin price hovers around $97,500 on Wednesday after declining 4.47% since Monday.
●Ethereum price closes below the daily support level of $3,721, indicating a continuation of ongoing pullback.
●Ripple price finds support around $1.96; a firm close below this would indicate a decline ahead.
Bitcoin (BTC) price hovers around $97,500 on Wednesday after declining 4.47% so far this week. Ethereum (ETH) followed BTC’s lead and closed below the key support level, suggesting a continuation of the pullback ahead. Ripple (XRP) bounced off its crucial support level; a firm close below this would indicate a decline ahead.
Moreover, on Tuesday, the crypto market faced mixed sentiments after crypto community members spoke about the potential of Google’s new quantum chip, Willow’s ability to crack blockchain networks and render the security of public key cryptography useless.
Bitcoin bulls show signs of weakness
Bitcoin price declined 4.47% so far this week until Tuesday. At the time of writing on Wednesday, it hovers around $97,500.
Traders should be cautious as the Relative Strength Index on the daily chart shows signs of weakness. The recent uptrend in Bitcoin price since mid-November reflects a falling RSI level during the same period, indicating diminishing bullish strength. Moreover, if the RSI daily closes below the neutral level of 50, it generally indicates bearish momentum is gaining traction.
If BTC continues its decline and closes below the $90,000 support level, it could extend losses toward the next support level of $85,000.
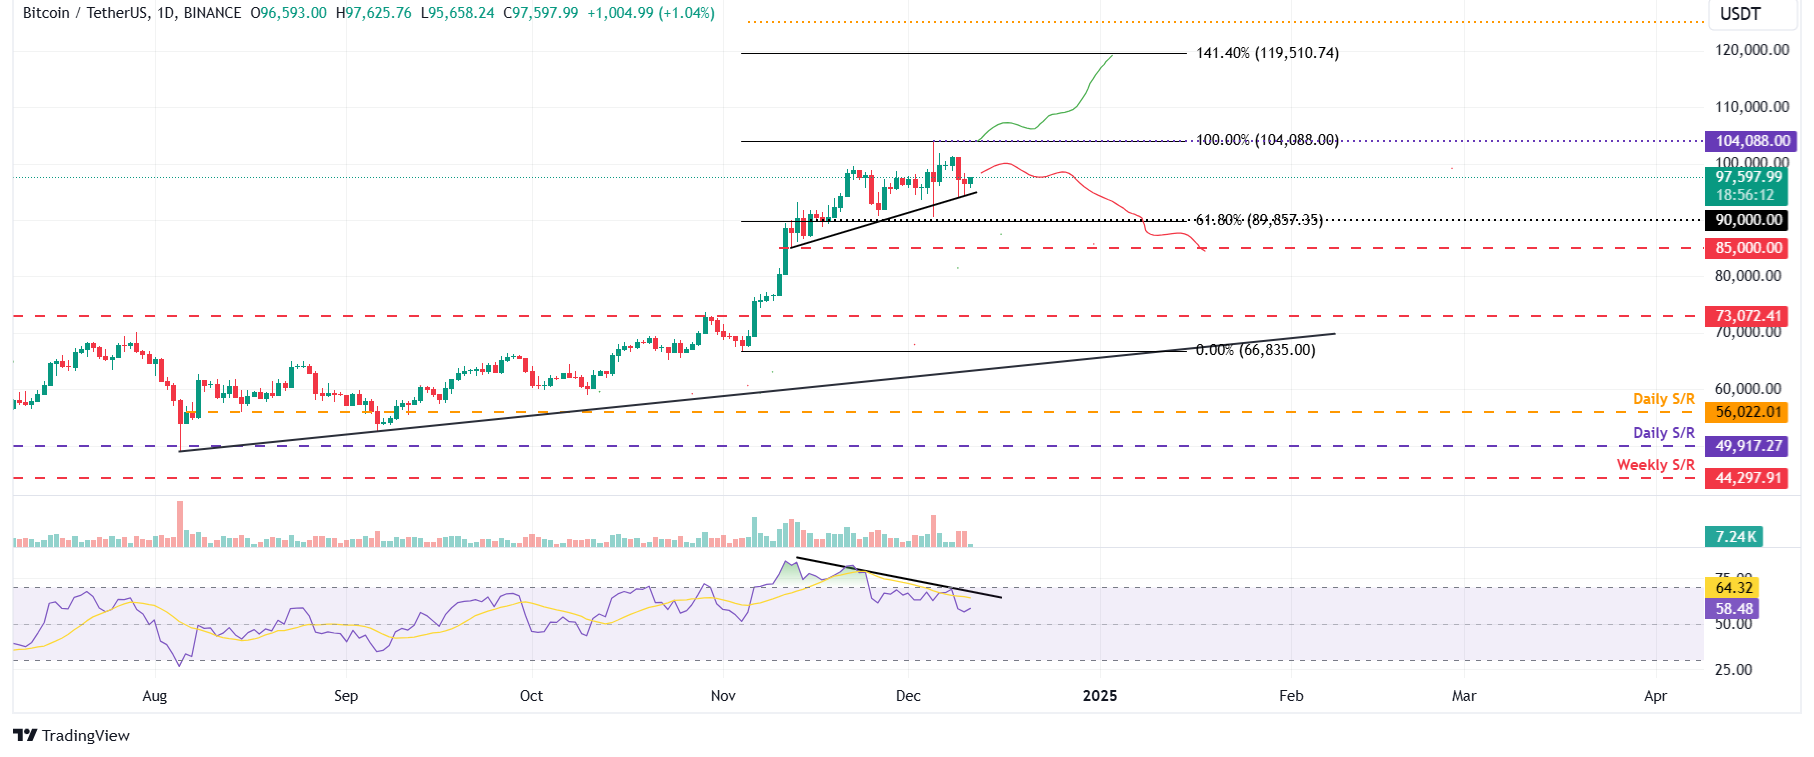
BTC/USDT daily chart
Conversely, if BTC continues its recovery and closes above $104,088, it could extend the rally toward a new all-time high of $119,510. This level aligns with the 141.4% Fibonacci extension line drawn from the November 4 low of $66,835 to Thursday’s all-time high of $104,088.
Ethereum price set for a decline as it closes below daily support
Ethereum price faced rejection from the $4,000 level on Friday and declined 9.4% until Tuesday, closing below its daily support level of $3,721. At the time of writing on Wednesday, it recovers slightly, trading at around $3,660.
If ETH continues its decline, it could extend the fall to retest its weekly support level at $3,454. A successful close below this level could extend an additional decline to retest its psychological importance level of $3,000.
The RSI on the daily chart reads 55 and points downwards after rejecting the overbought level of 70, suggesting weakness in bullish momentum. The Moving Average Convergence Divergence (MACD) indicator also supports the price decline. The MACD line shows a bearish crossover on Tuesday, indicating sell signals.
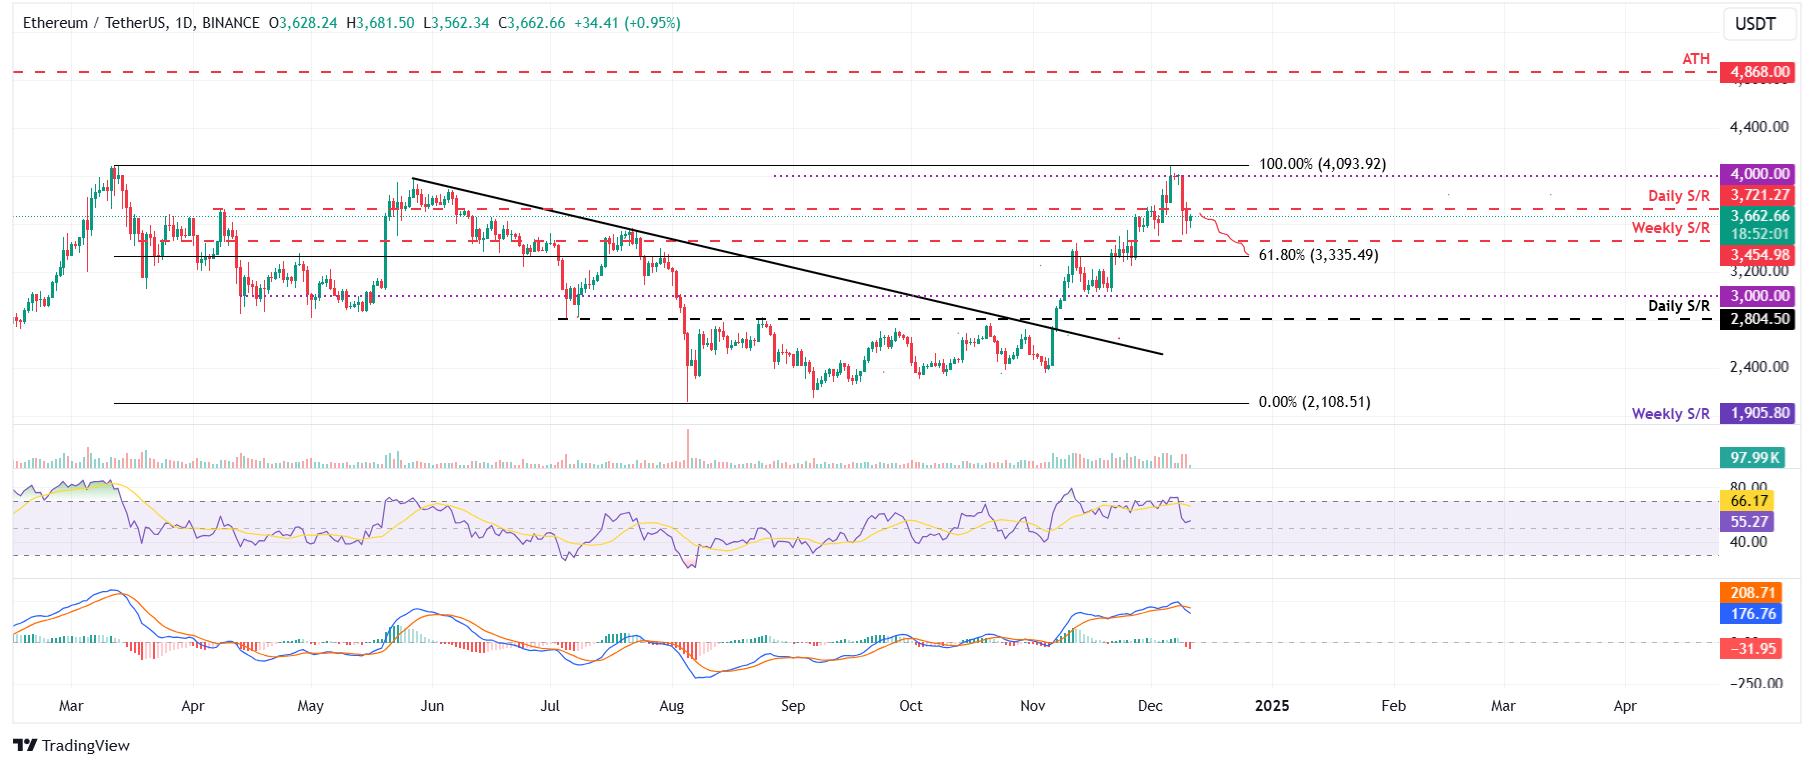
ETH/USDT daily chart
However, if ETH rallies and closes above $4,000, it could extend the rally to retest the $4,200 level.
Ripple could face a downturn if it closes below $1.96 support level
Ripple price faced resistance around the $2.66 level on Sunday and declined more than 15% the next day. On Tuesday, it rebounds 7% after retesting its $1.96 support level. At the time of writing on Wednesday, it hovers around $2.33.
If XRP declines and closes below the $1.96 level, it could extend the decline to retest its weekly support level at 1.40.
The RSI on the daily chart reads 63 and points downwards after rejecting the overbought level of 70, suggesting weakness in bullish momentum. Additionally, the MACD indicator also supports the Ripple price decline. The MACD line shows a bearish crossover on Tuesday, indicating sell signals.
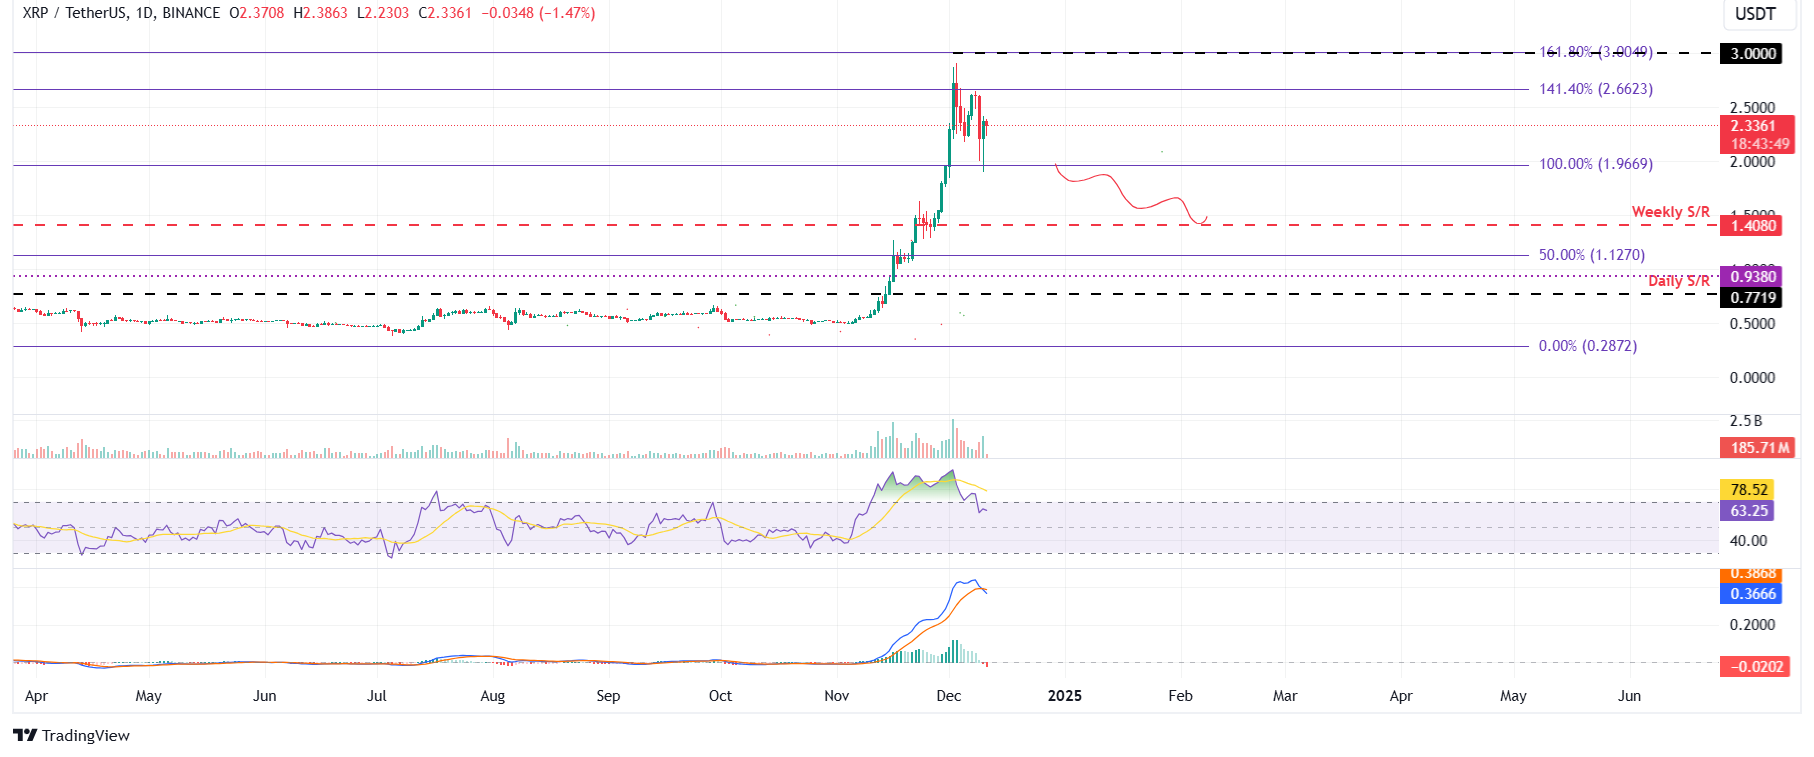
XRP/USDT daily chart
However, if XRP rallies and closes above the $2.66 level, it could extend the rally to retest the psychologically important level of $3.00.
Read more
* The content presented above, whether from a third party or not, is considered as general advice only. This article should not be construed as containing investment advice, investment recommendations, an offer of or solicitation for any transactions in financial instruments.


