


Ethereum Price Forecast: Who's behind ETH's highest daily gain in four years?
Ethereum price today: $2,330
- Ethereum's 21% surge on Thursday marked its highest single-day gain since May 2021.
- The rally was likely spurred by crypto native investors on the spot market who withdrew a net of 180K ETH from exchanges.
- ETH could surge past the $2,500 and $2,850 key levels if its technical indicators on the weekly chart flip bullish.
Ethereum (ETH) is up 6% on Friday, extending its weekly gains to 29% after nearly two weeks of consolidation near $1,800. The recent rally stems from increased buying pressure from investors on the spot market following a sharp plunge in ETH's exchange reserve.
Spot investors sparked ETH's 21% gain
Ethereum recorded a 21.8% gain on Thursday, its highest single day gain since May 24, 2021, according to the Binance ETH/USDT TradingView chart.
Despite the rise, US spot Ether ETFs stretched their negative flows to three consecutive days of net outflows after shedding $16.11 million on Thursday, per SoSoValue data. Ethereum's funding rates also remained at normal levels near 0.01, indicating the rally wasn't inspired by ETF flows or high leverage trading.
Crypto native spot investors likely fueled the buying pressure, with Ethereum's exchange reserve plunging by nearly 180,000 ETH in the past 24 hours, now more than 450,000 ETH in two weeks.
-1746823315969.png)
ETH Exchange Reserve. Source: CryptoQuant
A portion of the buying can also be traced to institutions, with Abraxas Capital withdrawing 138,511 ETH from exchanges Binance and Kraken in the past two days, per wallet tracker Lookonchain.
Active addresses on Ethereum also increased from 458,000 to 563,000 within the past 24 hours, indicating rising interest from crypto native investors, per Santiment data.
With the price surge, ETH's Weighted Sentiment, which measures its net positive and negative sentiment compared with social volume, soared to 5.2, its highest since May 2024.
 [21-1746823346833.21.11, 09 May, 2025].png)
ETH Weighted Sentiment. Source: Santiment
The change in sentiment toward ETH follows the activation of the Pectra upgrade on mainnet on Wednesday — introducing features geared at improved user experience, staking efficiency and scalability — and a leadership restructuring at the Ethereum Foundation (EF).
Ethereum Price Forecast: ETH eyes recovery above $2,500 and $2,850 key levels
Ethereum saw $364 million in futures liquidations in the past 24 hours, per Coinglass data. The total amount of liquidated long and short positions is $158.74 million and $205.61 million, respectively.
Since the crypto market rally on Thursday, ETH jumped nearly 30% from $1,800 to test the $2,500 key resistance — strengthened by the 100-week Simple Moving Average (SMA) — before seeing a rejection. ETH has to clear the $2,500 and $2,850 key resistance levels to stage a major recovery toward the upper boundary of a key congestion pattern. The top altcoin could see a short-term correction near these levels if its uptrend continues.
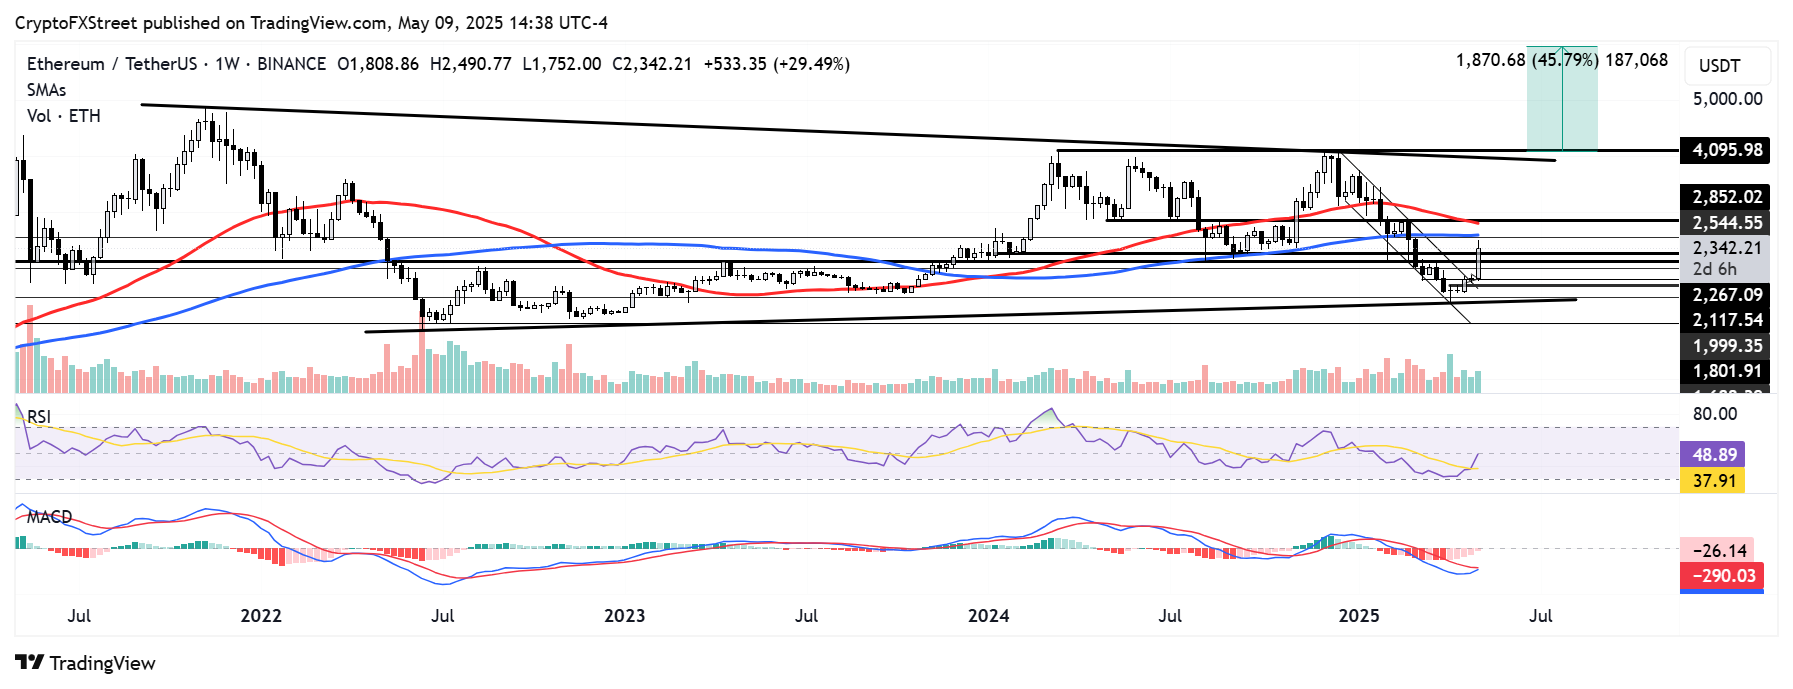
ETH/USDT weekly chart
The Relative Strength Index (RSI) has crossed above its yellow moving average line and is testing its neutral level. Meanwhile, the Moving Average Convergence Divergence (MACD) is testing its moving average line and neutral level. A firm cross of the RSI and MACD above their neutral levels could strengthen the bullish momentum and push ETH above $2,850.
A weekly candlestick close below $1,680 will invalidate the bullish thesis and send ETH toward the key support near $1,400.
Recommended Articles


