


USD/CHF Price Forecast: Holds firm above 0.7900, yet remains bearish
- USD/CHF confined in 0.7909–0.7934 range during Tuesday’s session, amid the Lack of catalysts.
- Dark cloud cover pattern and bearish RSI reinforce downside risk toward the 2025 low of 0.7829.
- Bulls need recovery above 0.8000 and 50-day SMA at 0.8015 to regain short-term control.
USD/CHF retreats on Tuesday yet it remains above the 0.7900 figure, below the key technical resistance an also beneath the 0.8000 mark, with the technical outlook suggesting the downtrend could soon resume. The pair remains on track to test the yearly low at 0.7829.
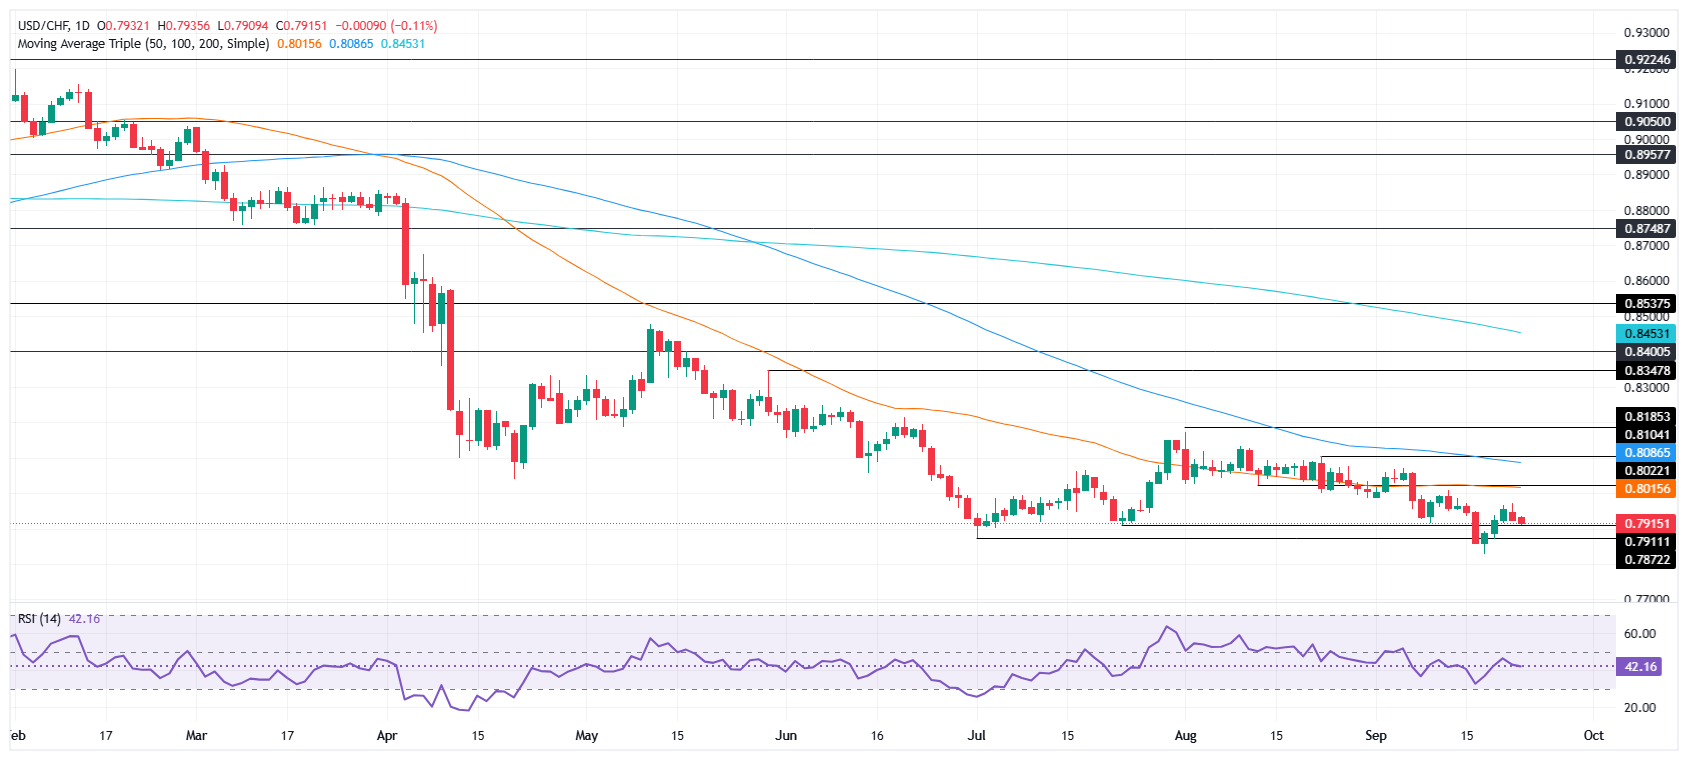
USD/CHF Price Forecast: Technical outlook
The USD/CHF consolidated around the 0.7909/0.7934 area during the day, amid the lack of a catalyst that could push prices to clear the bottom of the range. Even though the ‘dark cloud cover’ suggests that further downside is seen, sellers need to breach 0.7900 soo they can test the yearly low of 0.7829.
The Relative Strength Index (RSI) is pointing lower in bearish territory, further supporting downside potential.
On the flip side, a recovery above 0.7950 and subsequent breaks of 0.7970 and 0.8000 would strengthen bullish momentum, exposing the 50-day SMA at 0.8015.
USD/CHF Price Chart – Daily
Swiss Franc Price This Month
The table below shows the percentage change of Swiss Franc (CHF) against listed major currencies this month. Swiss Franc was the strongest against the Canadian Dollar.
| USD | EUR | GBP | JPY | CAD | AUD | NZD | CHF | |
|---|---|---|---|---|---|---|---|---|
| USD | -1.00% | -0.21% | 0.43% | 0.75% | -0.80% | 0.55% | -1.01% | |
| EUR | 1.00% | 0.79% | 1.38% | 1.76% | 0.19% | 1.56% | -0.02% | |
| GBP | 0.21% | -0.79% | 0.48% | 0.96% | -0.59% | 0.76% | -0.75% | |
| JPY | -0.43% | -1.38% | -0.48% | 0.39% | -1.21% | 0.15% | -1.40% | |
| CAD | -0.75% | -1.76% | -0.96% | -0.39% | -1.53% | -0.20% | -1.70% | |
| AUD | 0.80% | -0.19% | 0.59% | 1.21% | 1.53% | 1.36% | -0.17% | |
| NZD | -0.55% | -1.56% | -0.76% | -0.15% | 0.20% | -1.36% | -1.50% | |
| CHF | 1.01% | 0.02% | 0.75% | 1.40% | 1.70% | 0.17% | 1.50% |
The heat map shows percentage changes of major currencies against each other. The base currency is picked from the left column, while the quote currency is picked from the top row. For example, if you pick the Swiss Franc from the left column and move along the horizontal line to the US Dollar, the percentage change displayed in the box will represent CHF (base)/USD (quote).
Recommended Articles


