


Dow Jones Industrial Average struggles to hold onto tariff-fueled gains
- The Dow Jones explored the high end on Monday, but remains stuck near 40,000.
- Equities kicked off the new trading week on a high note, but bullish momentum faded quickly.
- Inconsistent tariff policies from the Trump administration continue to hamper market sentiment.
The Dow Jones Industrial Average (DJIA) kicked off Monday on a strong note, getting dragged higher by a general recovery fueled by a fresh spark in the tech rally. However, bullish sentiment faded quickly as investors face a long, slow crawl toward whatever the Trump administration has planned next for tariffs.
President Donald Trump delivered another about-face on his own tariffs, exempting key electronics and technology from triple-digit tariffs imposed on China. Markets were bolstered by the good news, but investors remain leery of the Trump team’s constant waffling on trade barriers, and are still braced for Donald Trump’s planned additional sectoral tariffs on things like lumber and pharmaceuticals.
This week’s economic data release schedule is notably less impactful than recent weeks, though US Retail Sales figures are on the docket for Wednesday. The trading week will also be shortened by the Easter holiday on Friday.
Read more stock news: Apple stock leads Dow Jones higher after Trump walks back consumer electronic tariffs
Dow Jones price forecast
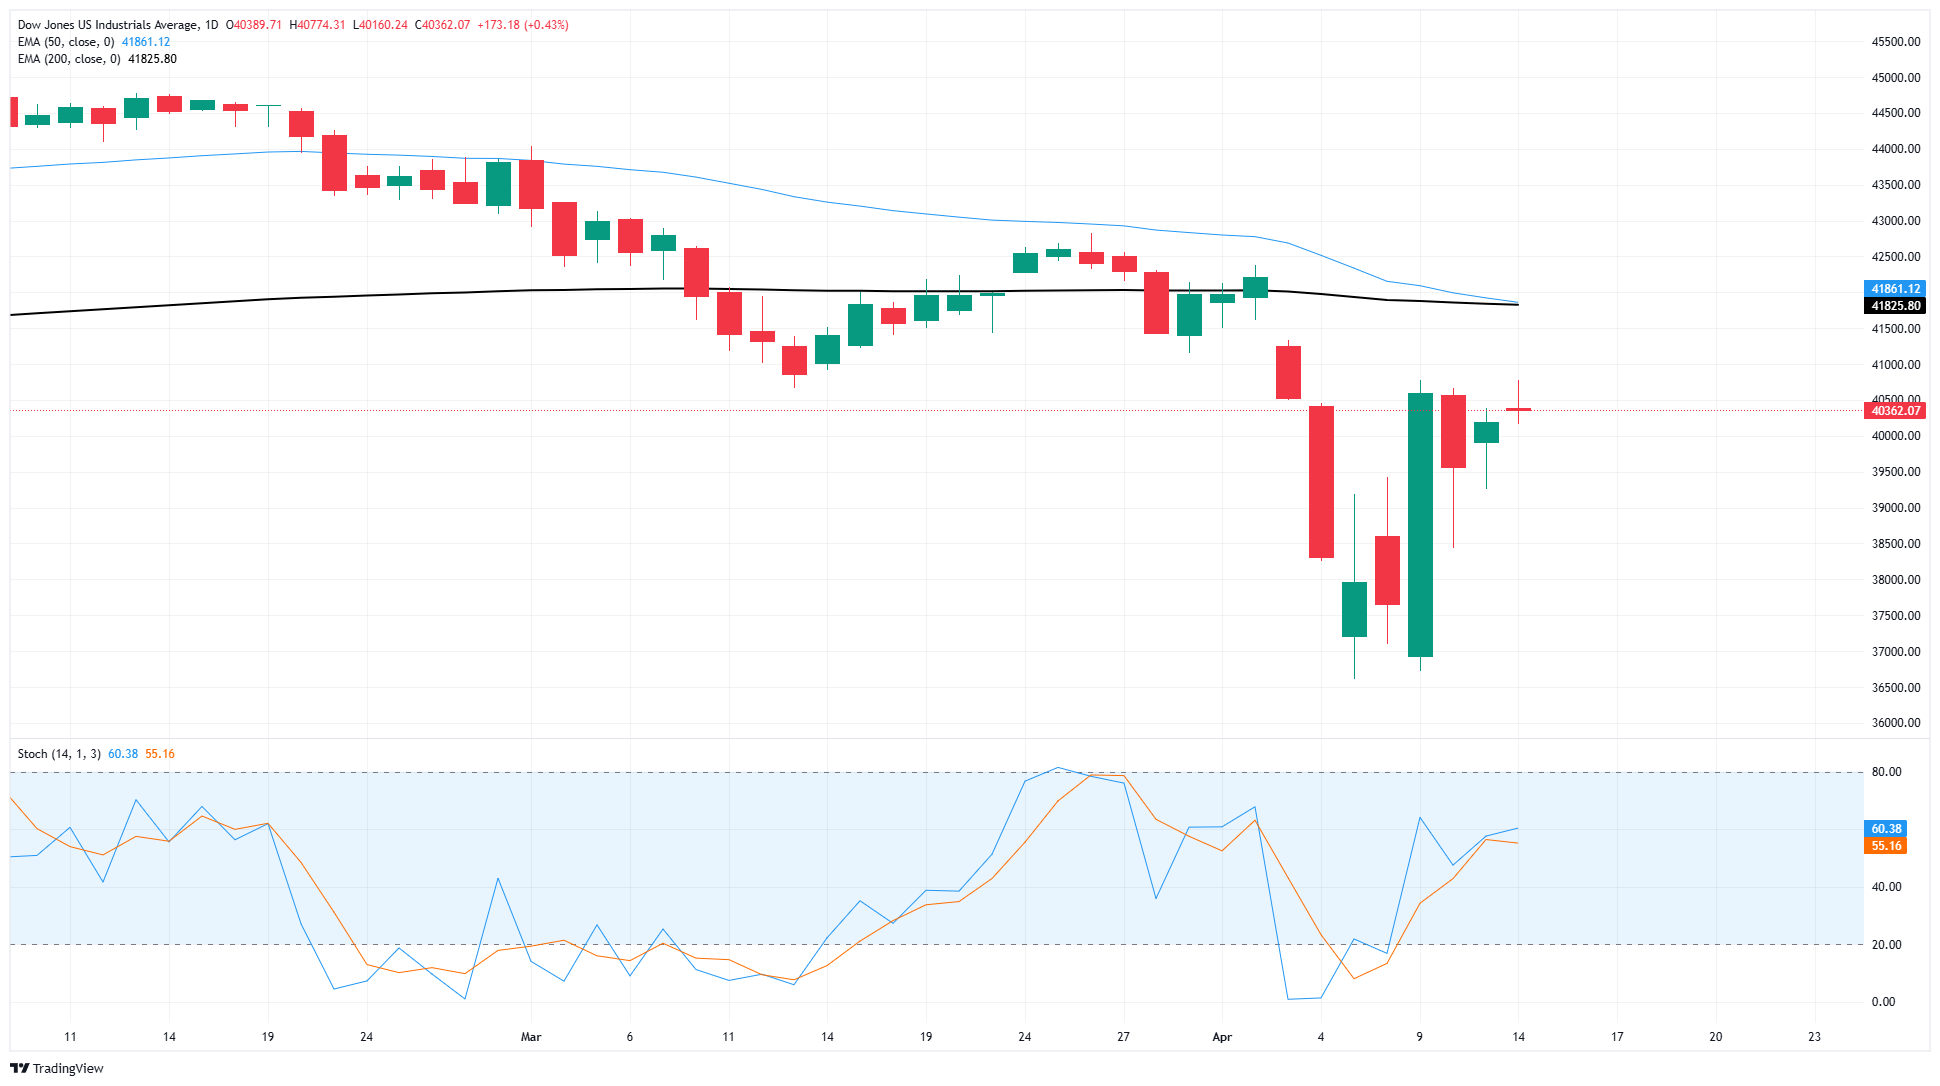
Despite an early pop, the Dow Jones remains pinned close to the 40,000 major price handle. Bullish momentum on the back of tariff adjustments has fizzled out, leaving the major equity index to battle it out in a tough resistance zone between 41,000 and 40,000.
The DJIA caught a stellar rebound from 16-month lows near 37,000, but price action is now caught in a rough consolidation phase below the 200-day Exponential Moving Average (EMA) near 41,825. A sharp uptick in volatility, but a decrease in directional momentum, has left charts a mess as investors get dragged around by the nose on tariff headlines.
Dow Jones daily chart
Dow Jones FAQs
The Dow Jones Industrial Average, one of the oldest stock market indices in the world, is compiled of the 30 most traded stocks in the US. The index is price-weighted rather than weighted by capitalization. It is calculated by summing the prices of the constituent stocks and dividing them by a factor, currently 0.152. The index was founded by Charles Dow, who also founded the Wall Street Journal. In later years it has been criticized for not being broadly representative enough because it only tracks 30 conglomerates, unlike broader indices such as the S&P 500.
Many different factors drive the Dow Jones Industrial Average (DJIA). The aggregate performance of the component companies revealed in quarterly company earnings reports is the main one. US and global macroeconomic data also contributes as it impacts on investor sentiment. The level of interest rates, set by the Federal Reserve (Fed), also influences the DJIA as it affects the cost of credit, on which many corporations are heavily reliant. Therefore, inflation can be a major driver as well as other metrics which impact the Fed decisions.
Dow Theory is a method for identifying the primary trend of the stock market developed by Charles Dow. A key step is to compare the direction of the Dow Jones Industrial Average (DJIA) and the Dow Jones Transportation Average (DJTA) and only follow trends where both are moving in the same direction. Volume is a confirmatory criteria. The theory uses elements of peak and trough analysis. Dow’s theory posits three trend phases: accumulation, when smart money starts buying or selling; public participation, when the wider public joins in; and distribution, when the smart money exits.
There are a number of ways to trade the DJIA. One is to use ETFs which allow investors to trade the DJIA as a single security, rather than having to buy shares in all 30 constituent companies. A leading example is the SPDR Dow Jones Industrial Average ETF (DIA). DJIA futures contracts enable traders to speculate on the future value of the index and Options provide the right, but not the obligation, to buy or sell the index at a predetermined price in the future. Mutual funds enable investors to buy a share of a diversified portfolio of DJIA stocks thus providing exposure to the overall index.
Recommended Articles


