


Crypto Today: Bitcoin volume cools amid steady ETF inflows while Ethereum and XRP prices consolidate
- Bitcoin trades near all-time highs amid cooling trading volume, a sign of consolidation.
- Ethereum pares losses after spot ETFs broke a three-day inflow streak on Thursday.
- XRP consolidates around $2.08 after extending losses on the previous day despite rising Open Interest in futures contracts.
The cryptocurrency market shows signs of cooling after staging a recovery from the weekend sell-off. Bitcoin (BTC) led the upswing, briefly stepping above $108,000 on Thursday before pulling back to consolidate at around $107,147 at the time of writing on Friday.
Leading altcoins, including Ethereum (ETH) and Ripple (XRP), have also retreated from their respective weekly highs, indicating sideways movement ahead of the weekend.
Data spotlight: Bitcoin trading volume cooling while Ethereum, XRP consolidate
The broader cryptocurrency market’s outlook remains relatively bullish despite geopolitical tensions and macroeconomic uncertainty, especially with United States (US) President Donald Trump’s 90-day tariff pause deadline approaching on July 9.
Interest in Bitcoin has steadied in the past few weeks, buoyed by positive investor sentiment, as market participants seek to hedge against a weakening US Dollar (USD).
Bitcoin spot Exchange Traded Funds (ETFs) net inflow volume hit a 13-day streak on Thursday, with SoSoValue reporting approximately $228 million. Although significantly lower than the $548 million posted on Wednesday, the net inflow volume affirms the steady risk-on sentiment. Cumulatively, BTC spot ETFs have amassed around $48.4 million in net inflows, with net assets averaging nearly $134 billion.
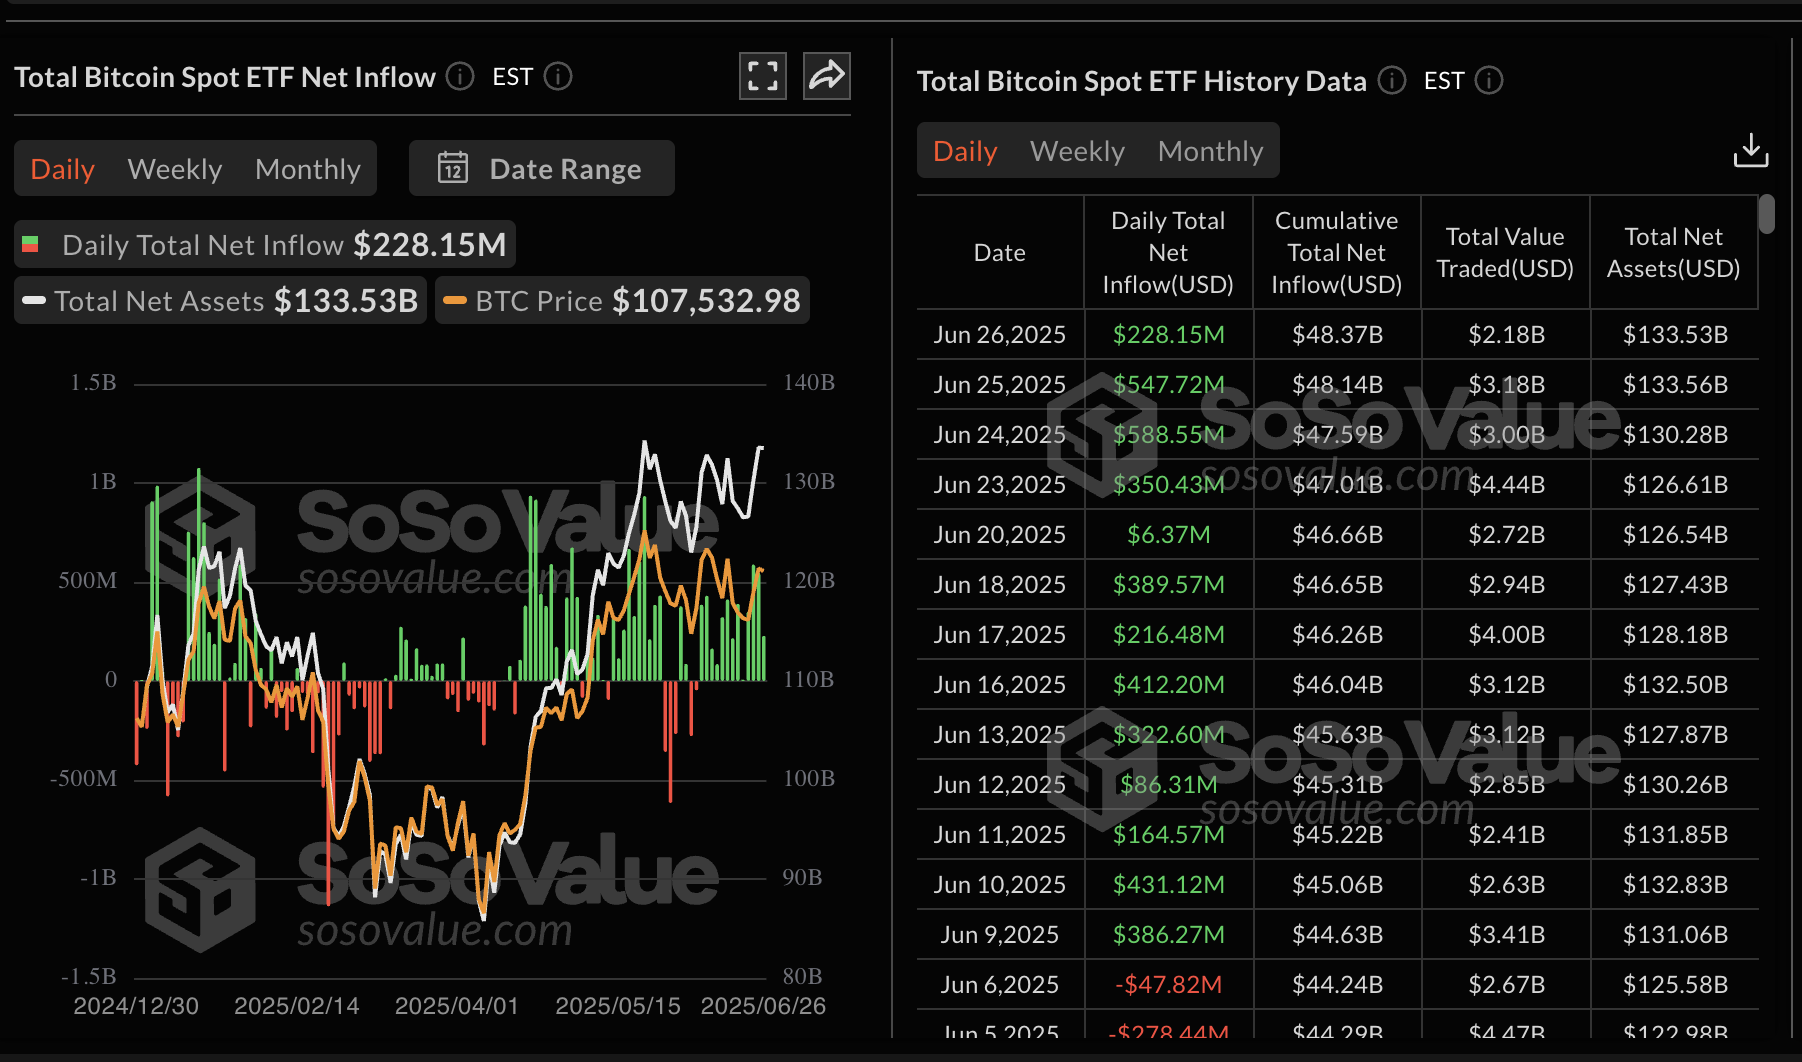
Bitcoin spot ETF data | Source: SoSoValue
In the spot market, Bitcoin trading volume shows signs of cooling without overheating, as indicated by CryptoQuant’s bubble chart below. Despite the BTC price hovering near all-time highs of $111,980, the digital asset portrays that volume is falling (cooling) with no signs of overheating (increasing) in sight.
Analysts at CryptoQuant say that Bitcoin has established a solid foundation, awaiting key catalysts such as interest rate cuts by the Federal Reserve or regulatory easing to break into new all-time highs.
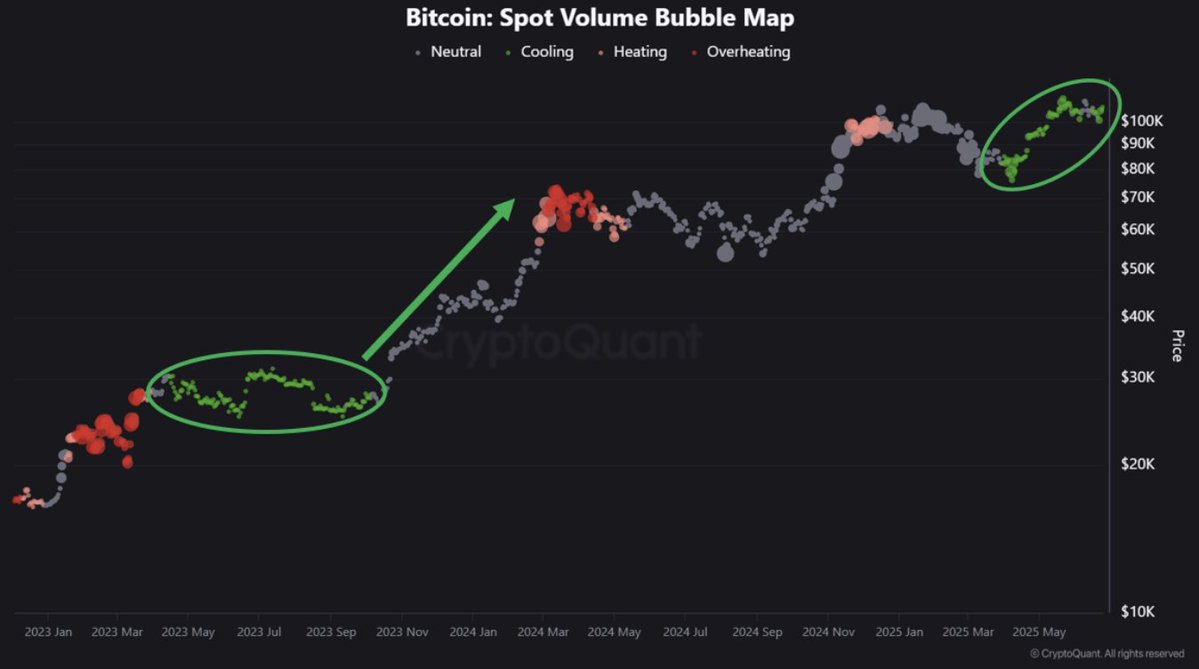
Bitcoin trading volume bubble map | Source: CryptoQuant
On the other hand, Ethereum spot ETFs broke a three-day net inflow streak on Thursday, with outflows summing to approximately $26.5 million. This outflow volume reflects diminishing investor interest in altcoins, which continue to struggle to recoup the losses triggered after the US struck Iranian nuclear sites on Saturday.
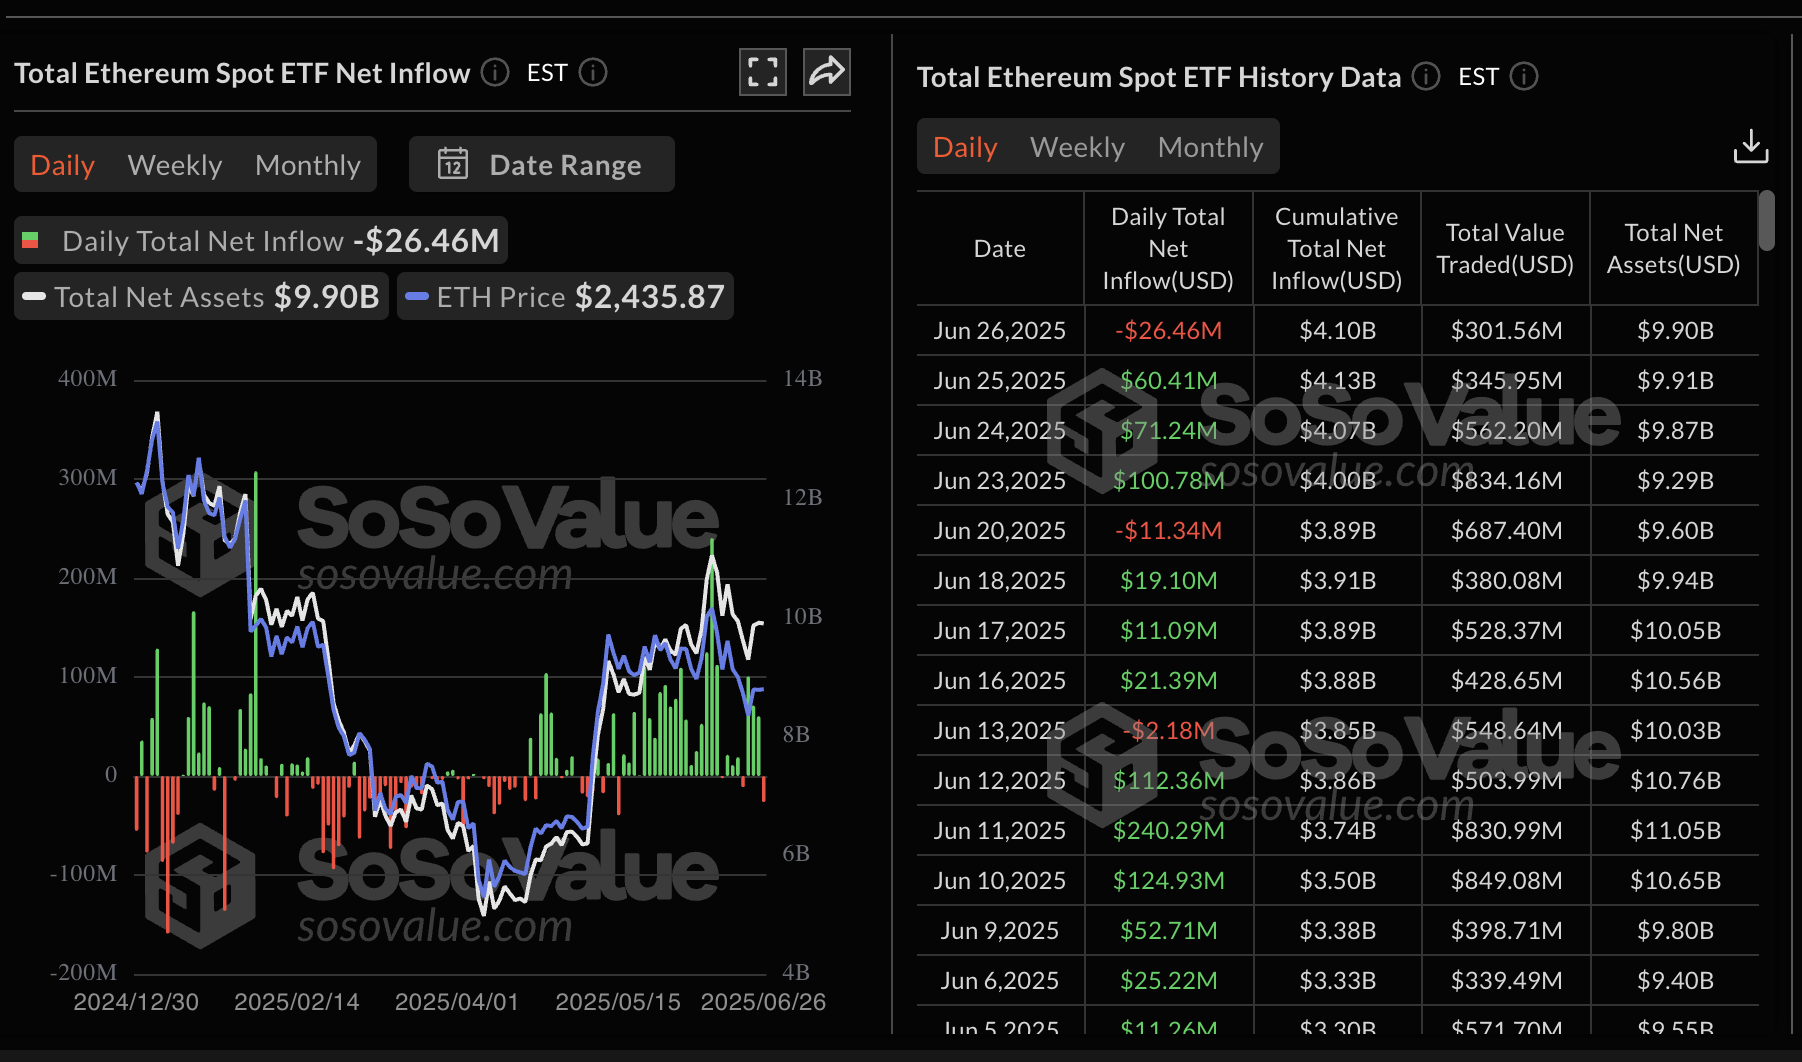
Ethereum spot ETF data | Source: SoSoValue
Meanwhile, the XRP futures Open Interest (OI), which tracks the number of active contracts (futures and options) that have yet to be settled or closed, has ticked up steadily to $4 billion on Friday from $3.54 billion on Monday.
The increase in OI indicates growing interest in XRP on risk-on sentiment. If the futures volume rises in tandem, the price of XRP could reach higher levels bolstered by swelling market activity.
Chart of the day: Bitcoin sends mixed technical signals
Bitcoin price offers mixed technical signals, with the Moving Average Convergence Divergence (MACD) indicator flashing a sell signal on the 4-hour chart below. Traders may consider reducing exposure to BTC, possibly due to profit-taking, as long as the blue MACD line crosses below the red signal line.
In addition to short-term support at $106,500 tested on Friday, other key tentative demand areas include the 50-period Exponential Moving Average (EMA) highlighted at $105,493 and the 200-period EMA at $104,808 in the same 4-hour timeframe.
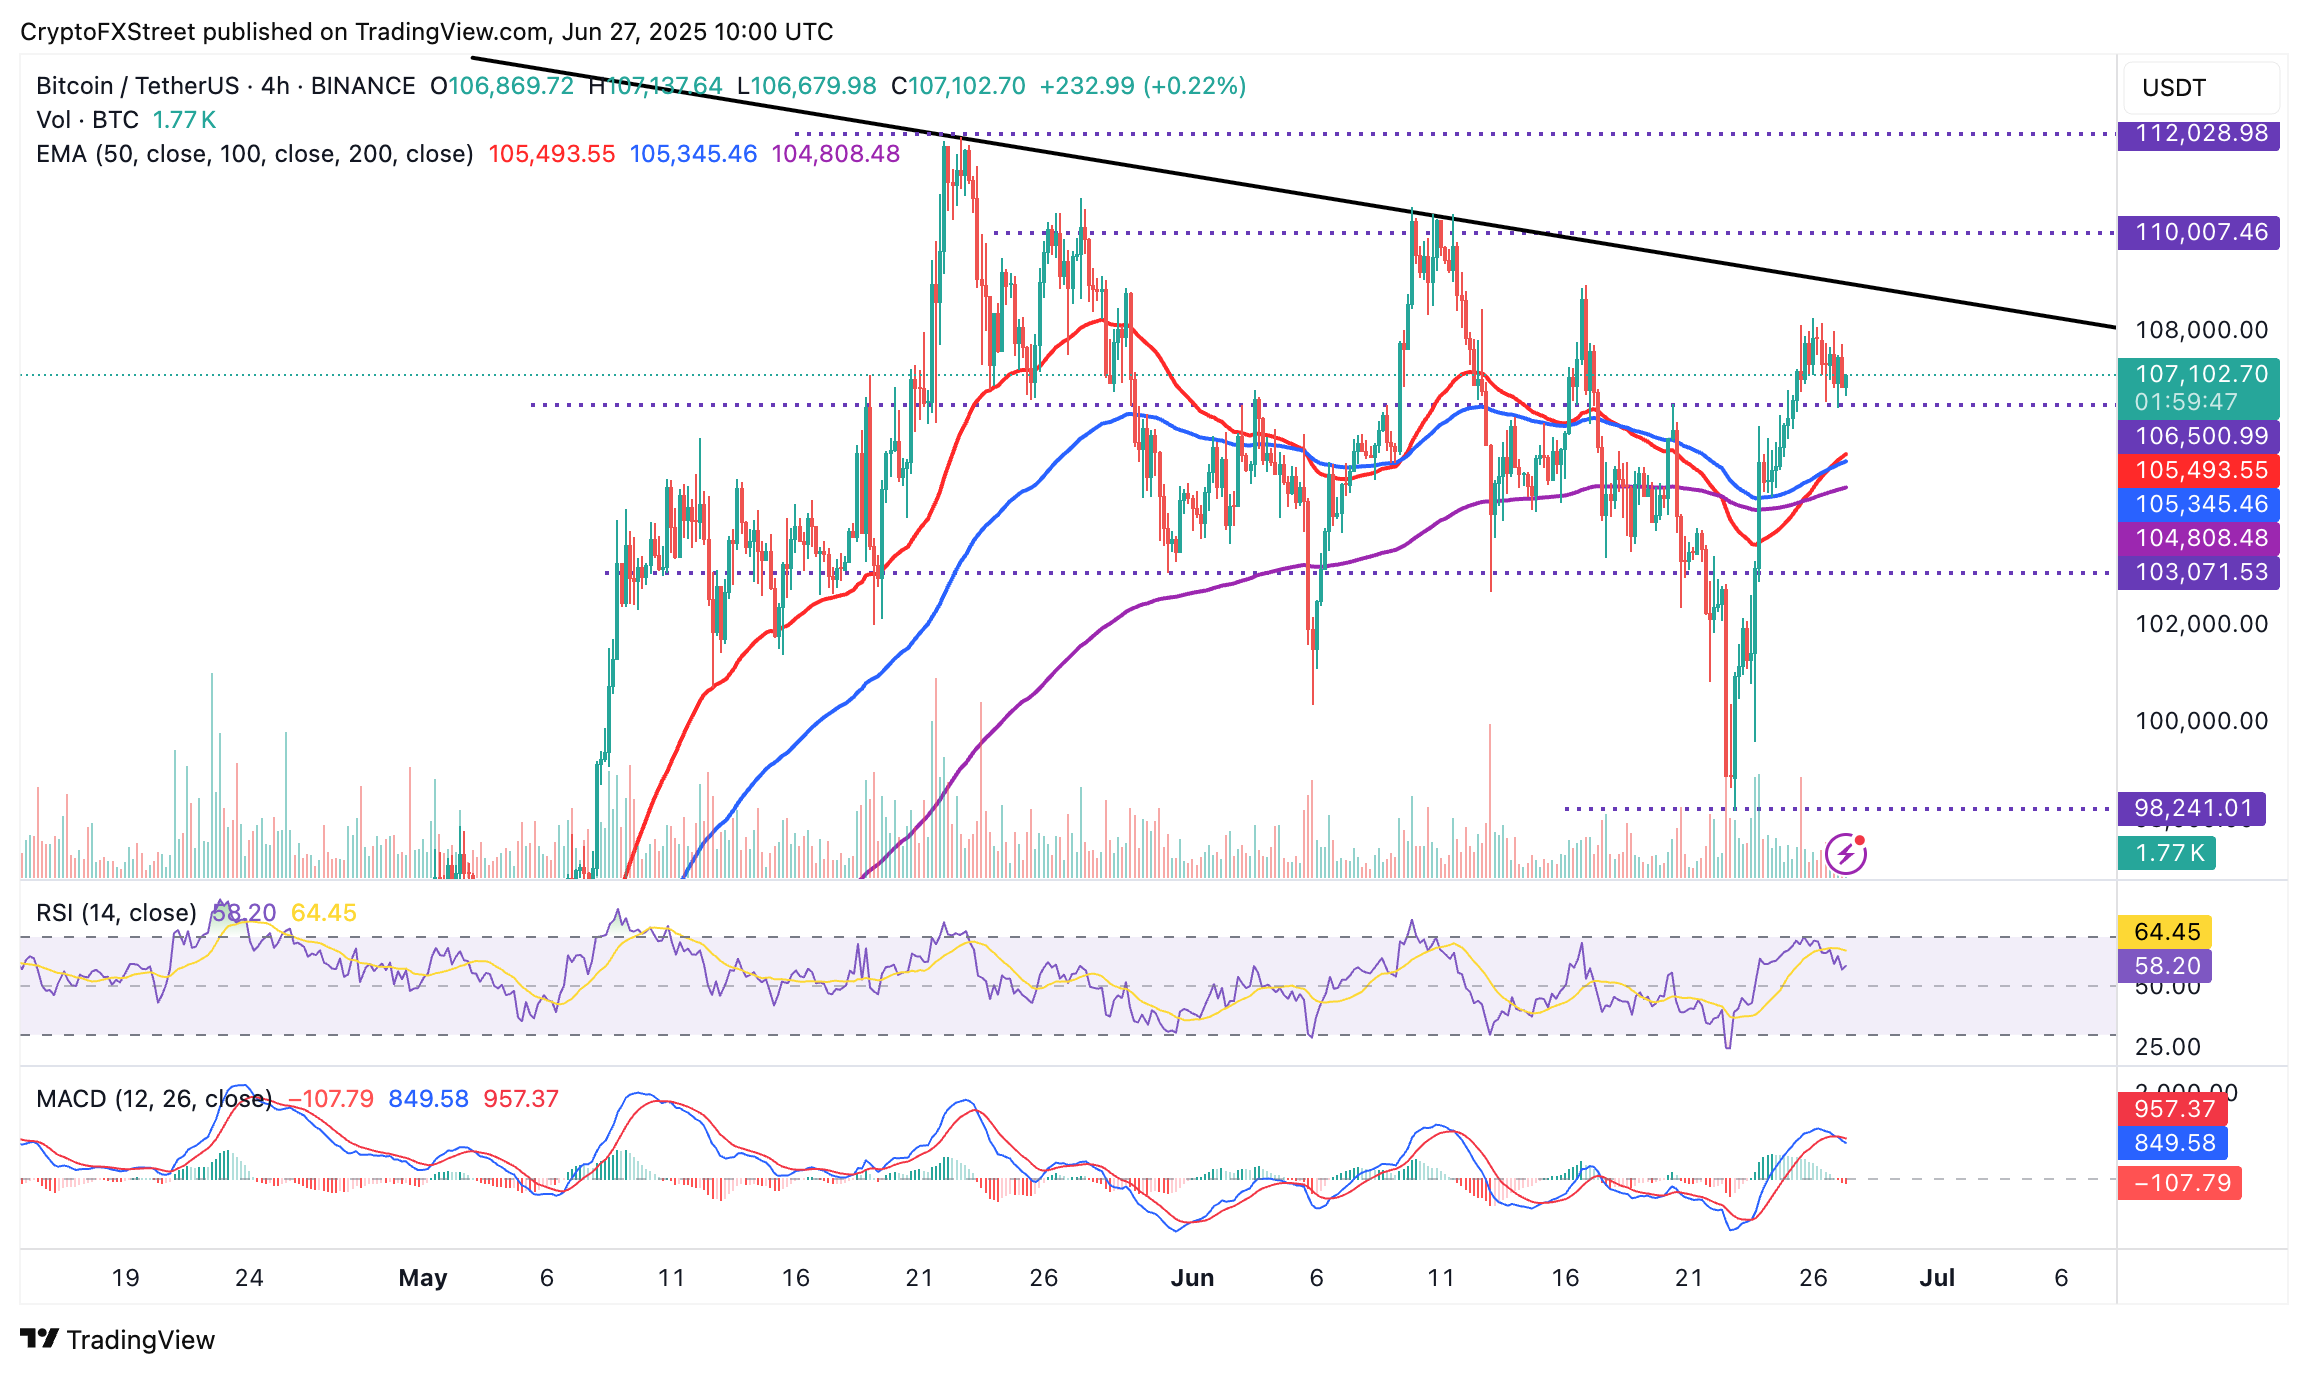
BTC/USD 4-hour chart
On the contrary, the 50-period EMA crossed above the 200-period EMA on Wednesday, validating a golden cross pattern, which could uphold risk-on sentiment. An increase in demand for BTC in the spot, futures and ETF markets could boost Bitcoin’s price toward all-time highs.
Altcoins update: Ethereum holds between support and resistance
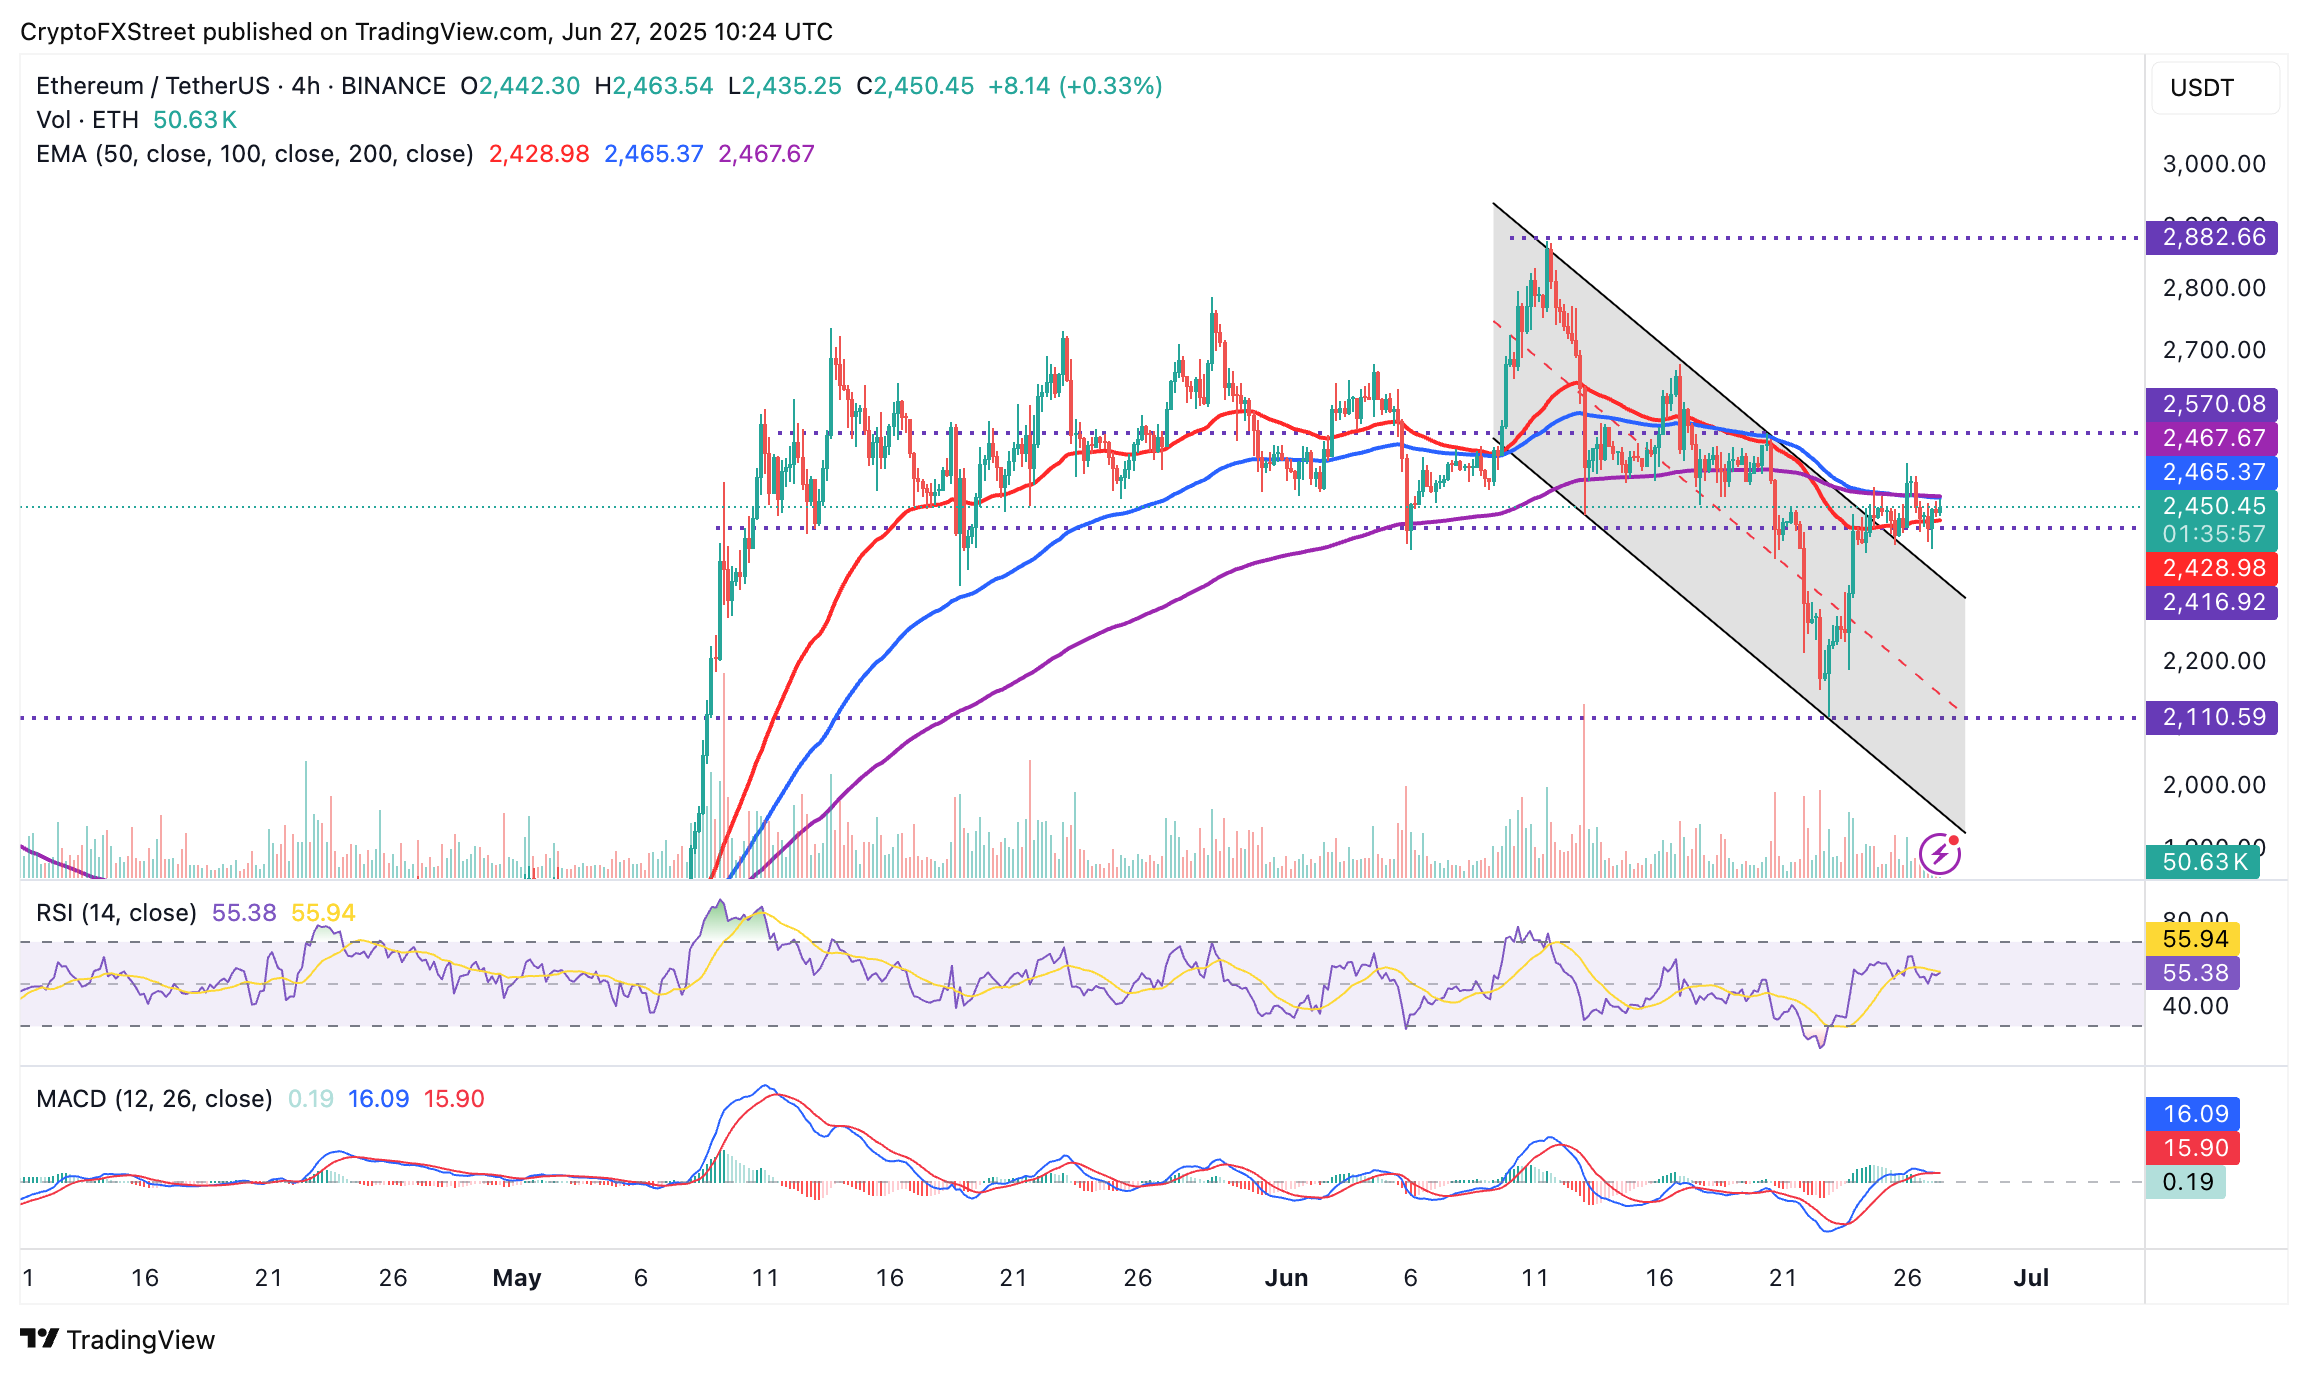
Ethereum’s price is currently trading at around $2,451 at the time of writing, with the 50-period EMA on the 4-hour chart providing immediate support. On the upside, a convergence established by the 100-period EMA and the 200-period EMA at around $2,467 serves as resistance.
The Relative Strength Index (RSI), currently at 55, suggests sideways trading and market indecision ahead of the weekend. A break above the $2,467 resistance level could see bulls expand their scope to $2,570, a seller congestion area tested on June 20 and the region at $2,882, last tested June 11.
ETH/USDT 4-hour chart
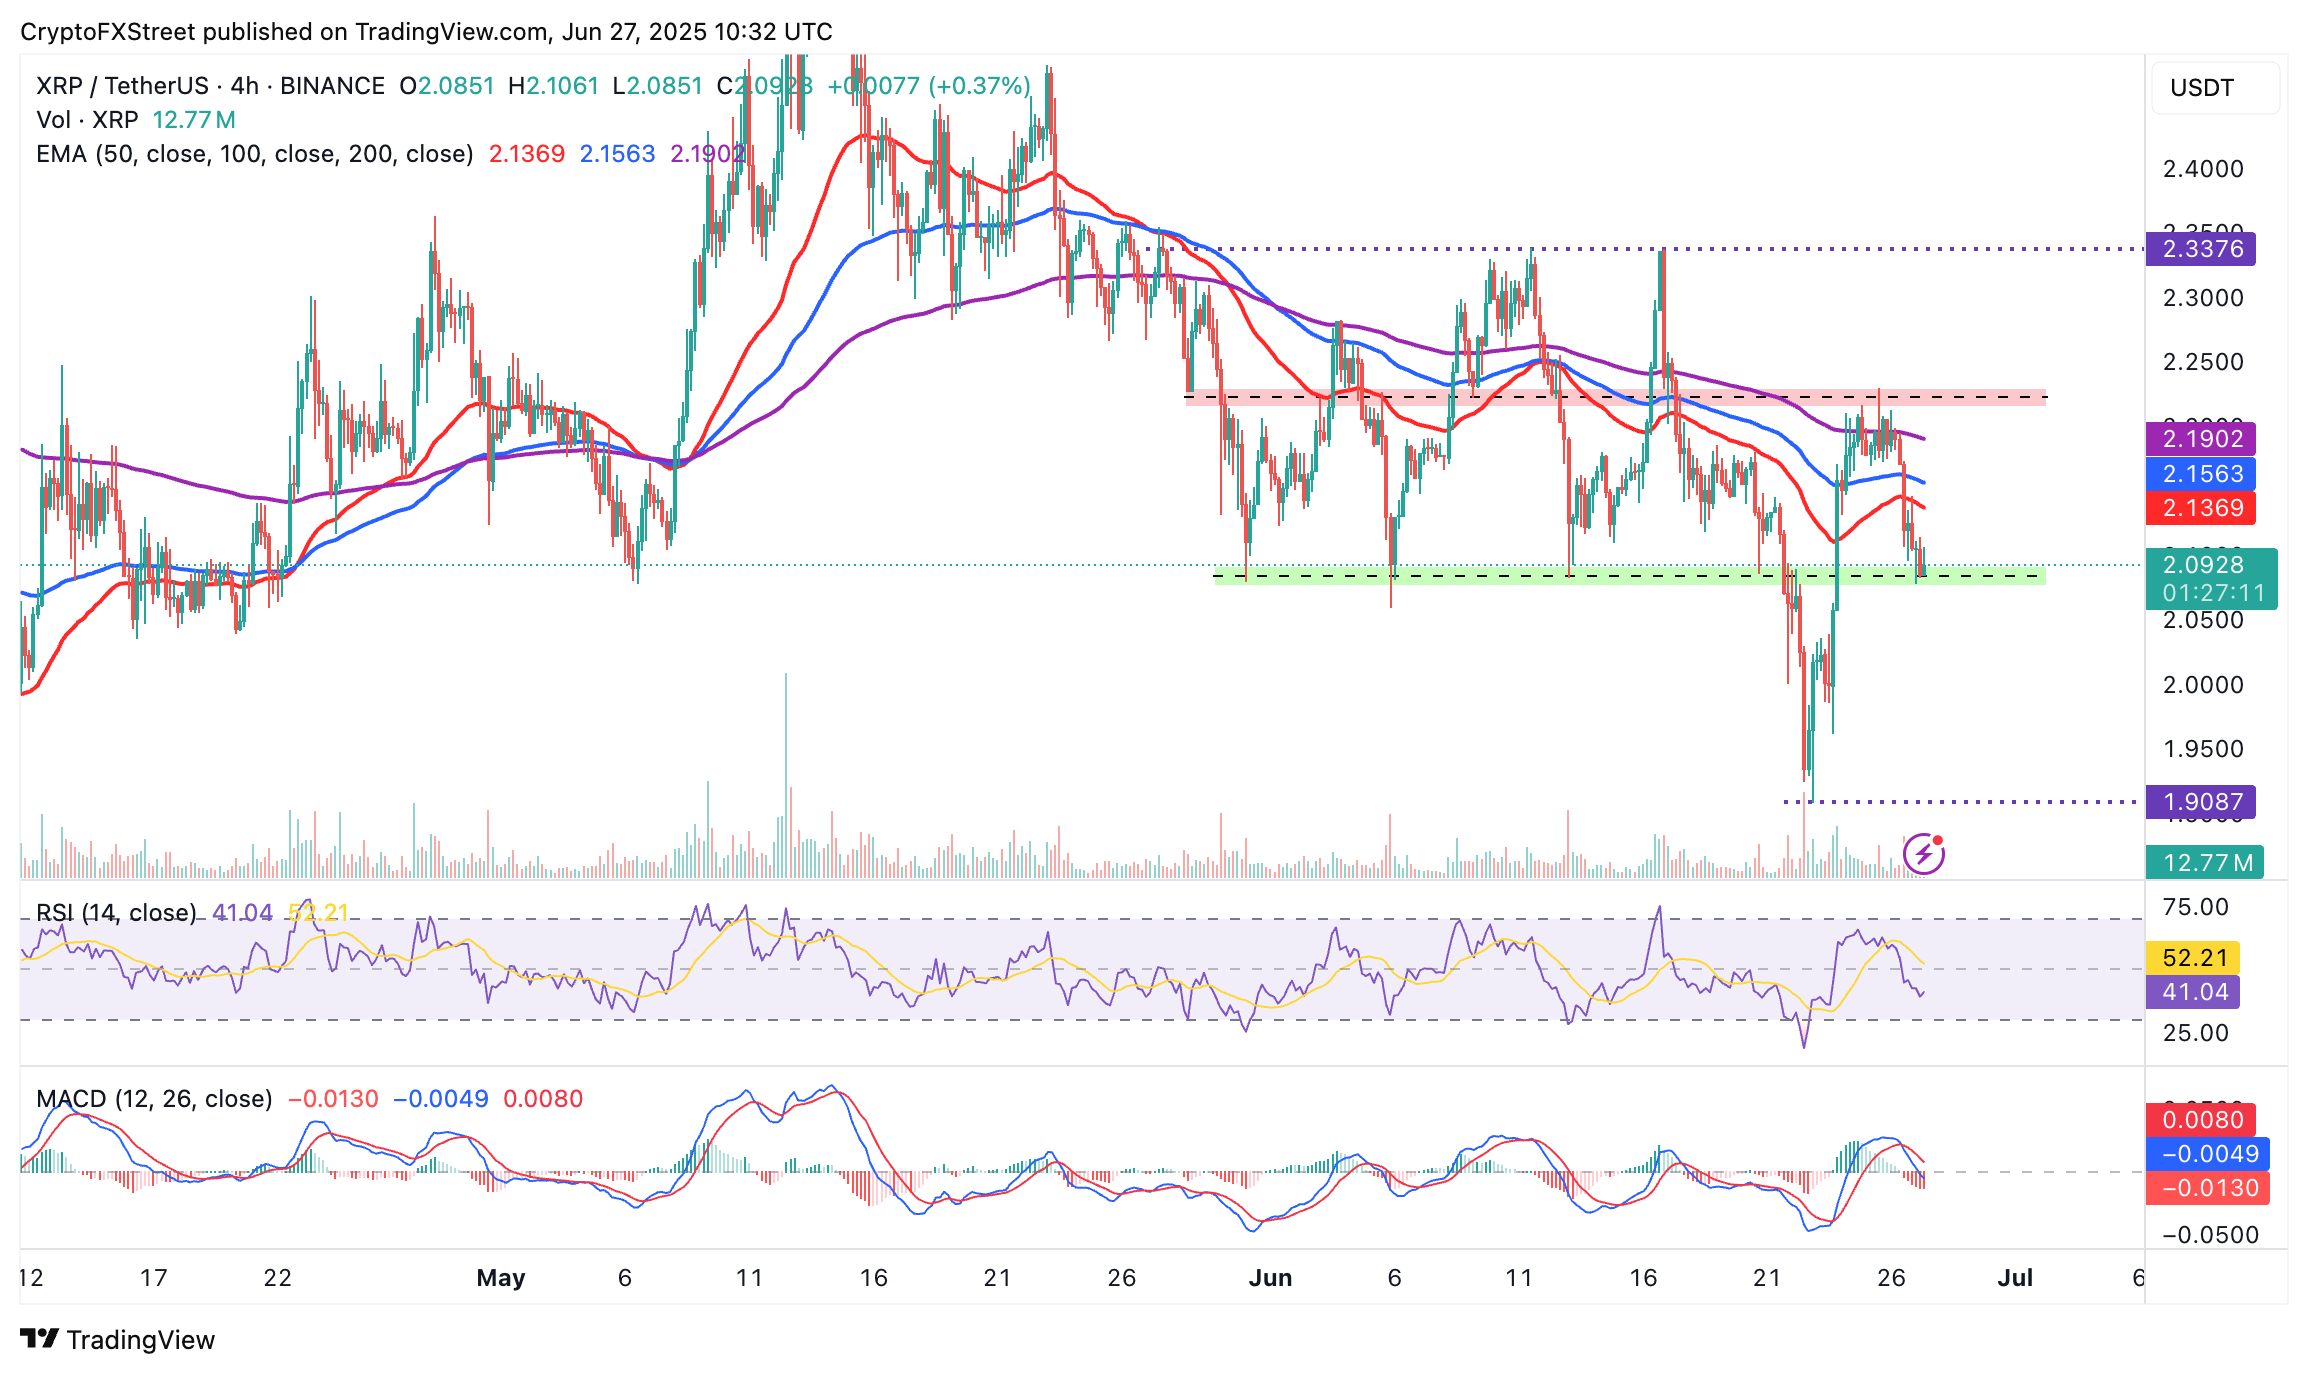
At the same time, traders with an interest in XRP may want to consider a sell signal sustained by the MACD indicator from Thursday, which implies a firm bearish bias. The RSI is also below the midline, at 41, after dropping from near-overbought conditions on Tuesday, further cementing the bearish influence.
XRP/USDT 4-hour chart
Still, traders should temper bearish expectations, considering that the XRP price is printing a 4-hour green candle above support at $2.08. If the uptrend holds in upcoming sessions, traders could aim for highs above the 200-period EMA at $2.19 and the resistance reached at $2.33 on Tuesday.
Cryptocurrency prices FAQs
Token launches influence demand and adoption among market participants. Listings on crypto exchanges deepen the liquidity for an asset and add new participants to an asset’s network. This is typically bullish for a digital asset.
A hack is an event in which an attacker captures a large volume of the asset from a DeFi bridge or hot wallet of an exchange or any other crypto platform via exploits, bugs or other methods. The exploiter then transfers these tokens out of the exchange platforms to ultimately sell or swap the assets for other cryptocurrencies or stablecoins. Such events often involve an en masse panic triggering a sell-off in the affected assets.
Macroeconomic events like the US Federal Reserve’s decision on interest rates influence crypto assets mainly through the direct impact they have on the US Dollar. An increase in interest rate typically negatively influences Bitcoin and altcoin prices, and vice versa. If the US Dollar index declines, risk assets and associated leverage for trading gets cheaper, in turn driving crypto prices higher.
Halvings are typically considered bullish events as they slash the block reward in half for miners, constricting the supply of the asset. At consistent demand if the supply reduces, the asset’s price climbs.
Recommended Articles


