


Top Meme Coins Price Predictions: Dogecoin, Shiba Inu, Pepe target new swing highs
- Dogecoin extends its recovery above the 50-day EMA, targeting a 200-day EMA breakout as risk-on sentiment rises among meme coins.
- Shiba Inu breakout rally triggers buy signal in the MACD indicator, projecting upside potential.
- Pepe takes a breather after a 3% surge on Tuesday, providing a buying opportunity for sidelined traders.
Meme coin Dogecoin (DOGE), Shiba Inu (SHIB) and Pepe (PEPE) recover sharply this week, overcoming the flash crash on Thursday. With a renewed risk-on sentiment, these top meme coins are projected to extend their bullish trend this week.
Dogecoin targets 200-day EMA breakout
Dogecoin prints its third consecutive bullish candle as it edges higher by around 1% at press time on Wednesday. With the recovery reaching $0.2019, the meme coin is up by almost 20% from the 7-day low at $0.1680 recorded after a flash crash on Thursday.
DOGE has crossed above the 50-day Exponential Moving Average at $0.1996 and aims to challenge the 200-day EMA at $0.2144. A closing above the 200-day EMA could propel Dogecoin towards the $0.2506 level, highlighted by a double top in May.
The momentum indicators on the daily chart back the trend reversal rally in DOGE, signaling increased buying pressure.
The Moving Average Convergence/Divergence (MACD) indicator nears its signal line for a bullish crossover in the negative territory. A concurrent decline in the bearish histogram bars suggests that the headwinds are fading away.
The Relative Strength Index (RSI) at 51 strikes above the halfway line after a quick V-shaped turnaround from the oversold zone, indicating trend reversal.
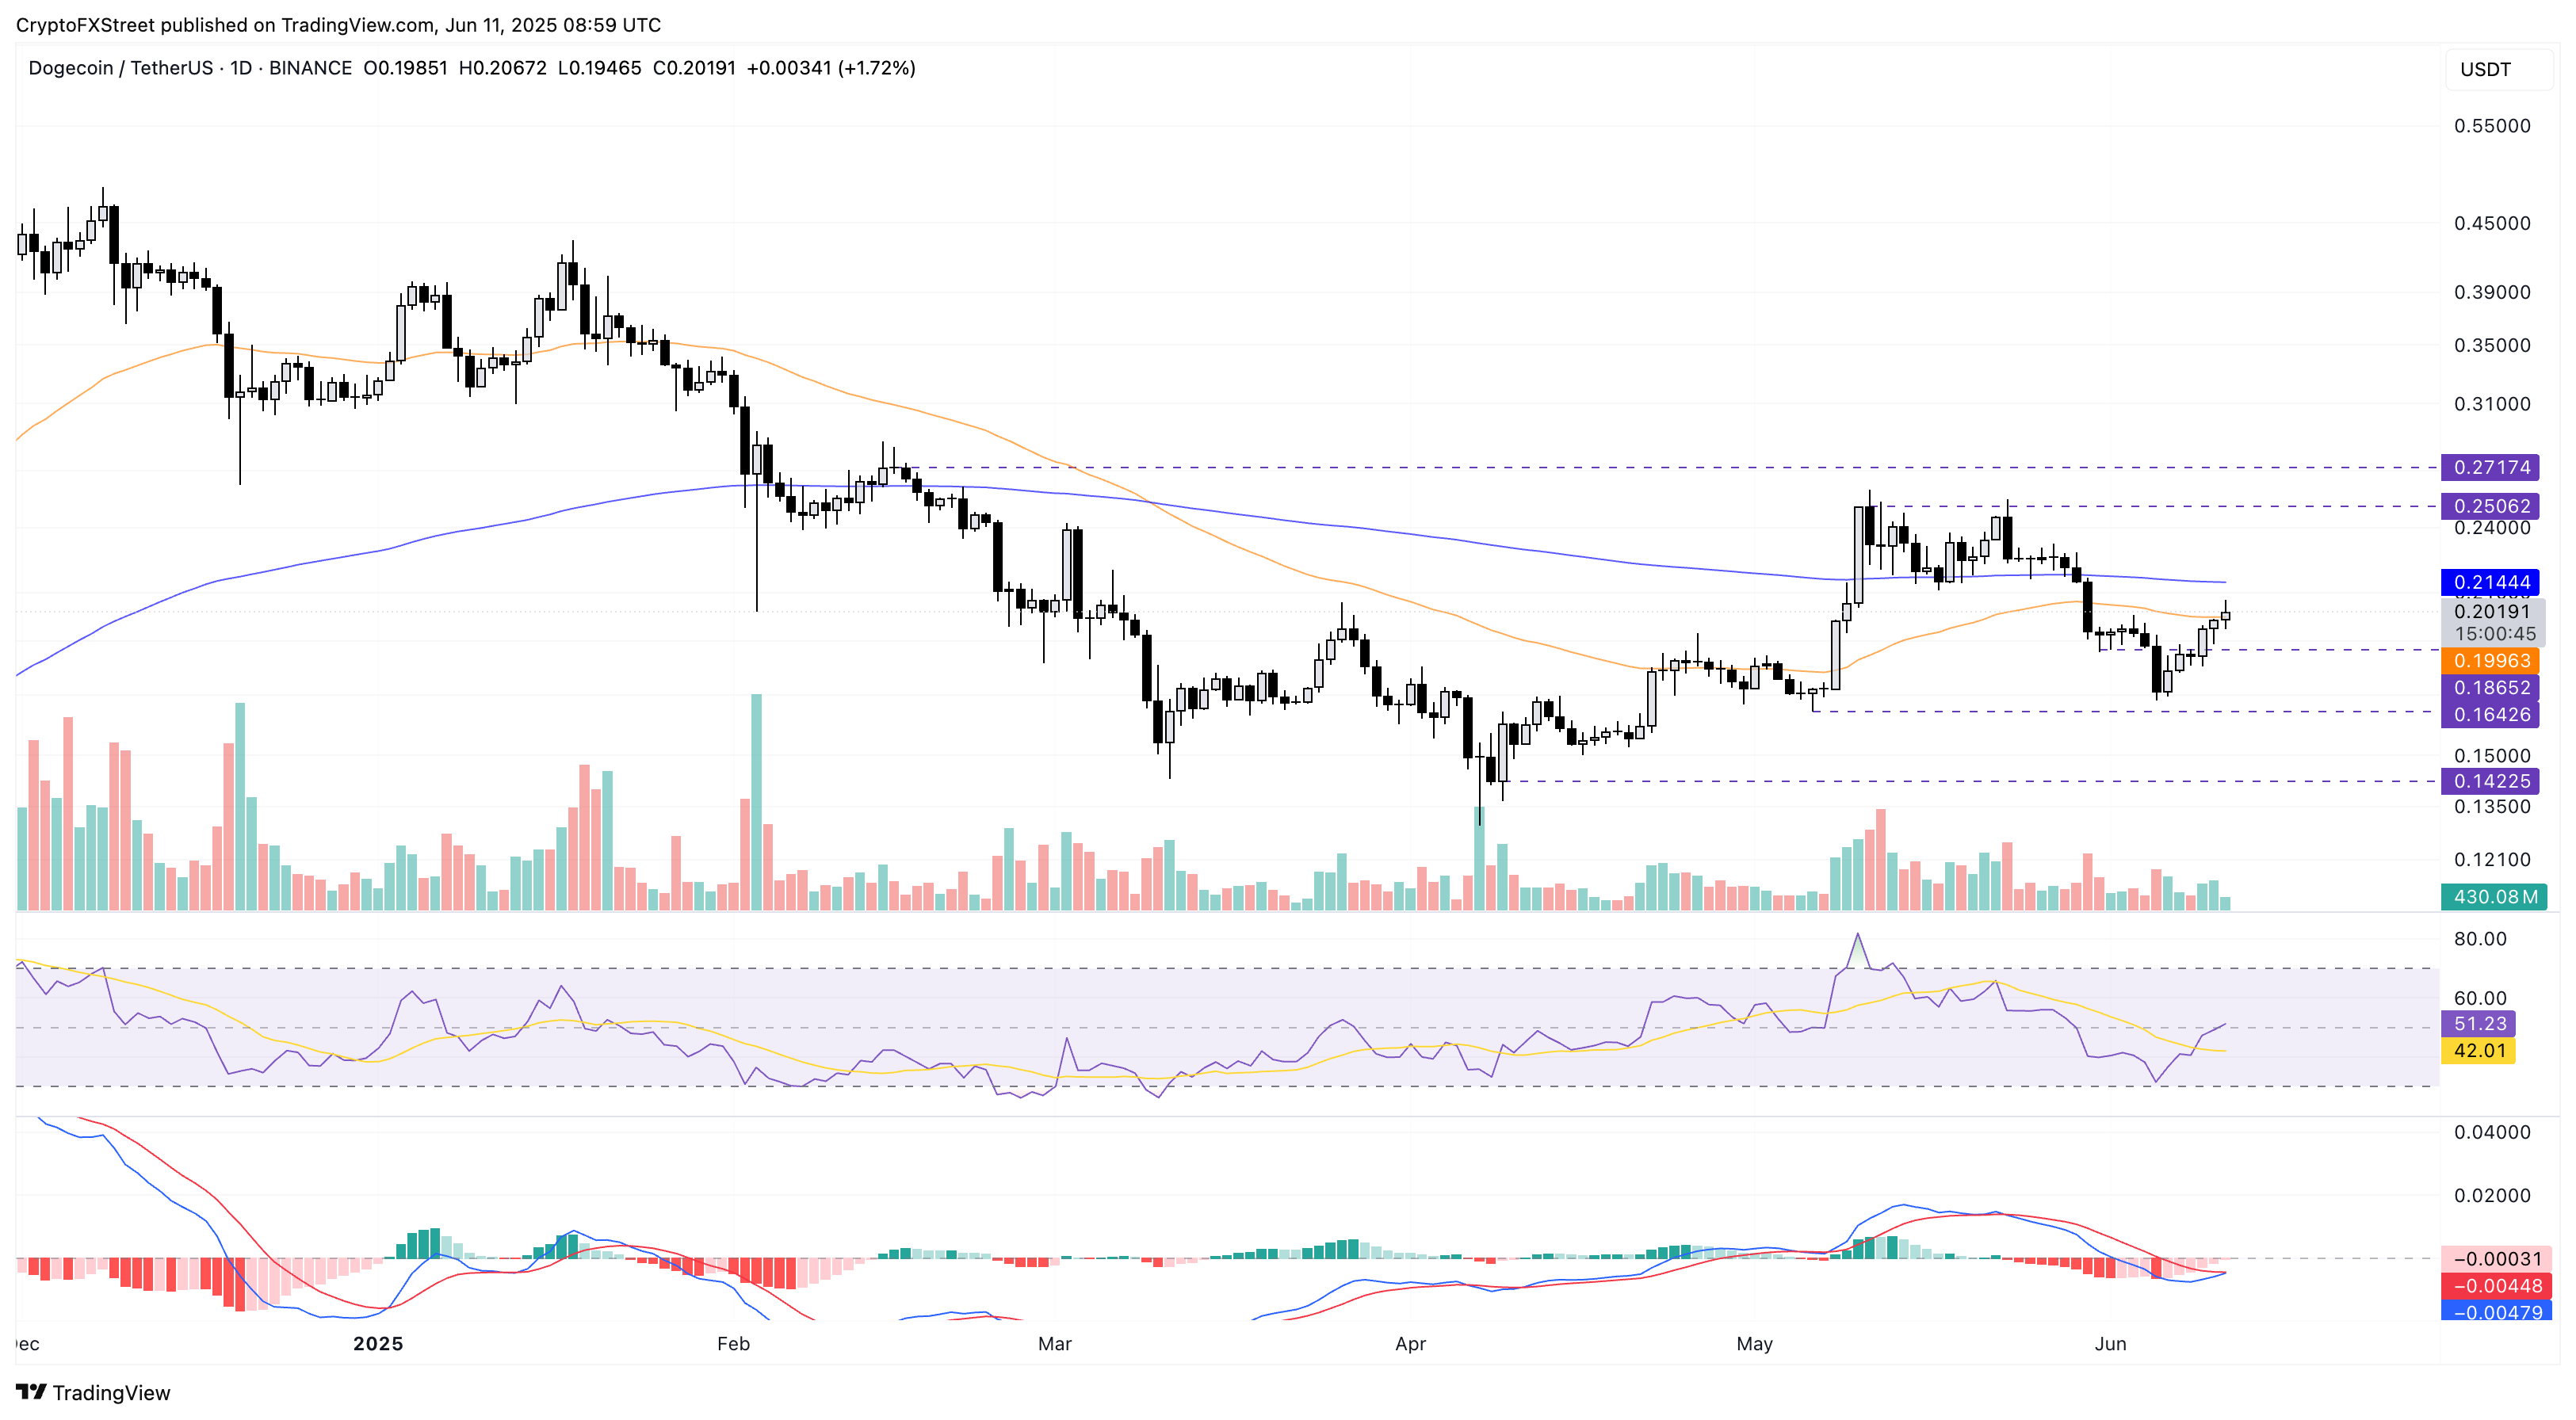
DOGE/USDT daily price chart.
However, a closing below the 50-day EMA could prolong the correction in Dogecoin to $0.1642, last tested on May 6.
Shiba Inu breaks a falling wedge
Shiba Inu marked the highest closing price in the last 12 days with a 1.91% surge to $0.00001338 on Tuesday. At the time of writing, SHIB corrects after facing opposition from the 50-day EMA at $0.00001361.
Following the breakout of a falling wedge on the daily chart (shared below), Shiba Inu is up over 6% so far this week. A decisive closing above the 50-day EMA could challenge $0.00001421 resistance marked by a peak on March 26.
The MACD indicator line crosses above its signal line, generating a new wave of bullish histogram bars from the zero line. This marks a trend reversal in Shiba Inu and suggests increased buying pressure.
The RSI indicator at 48 highlights a delayed surge in bullish momentum, as it remains below the halfway level.
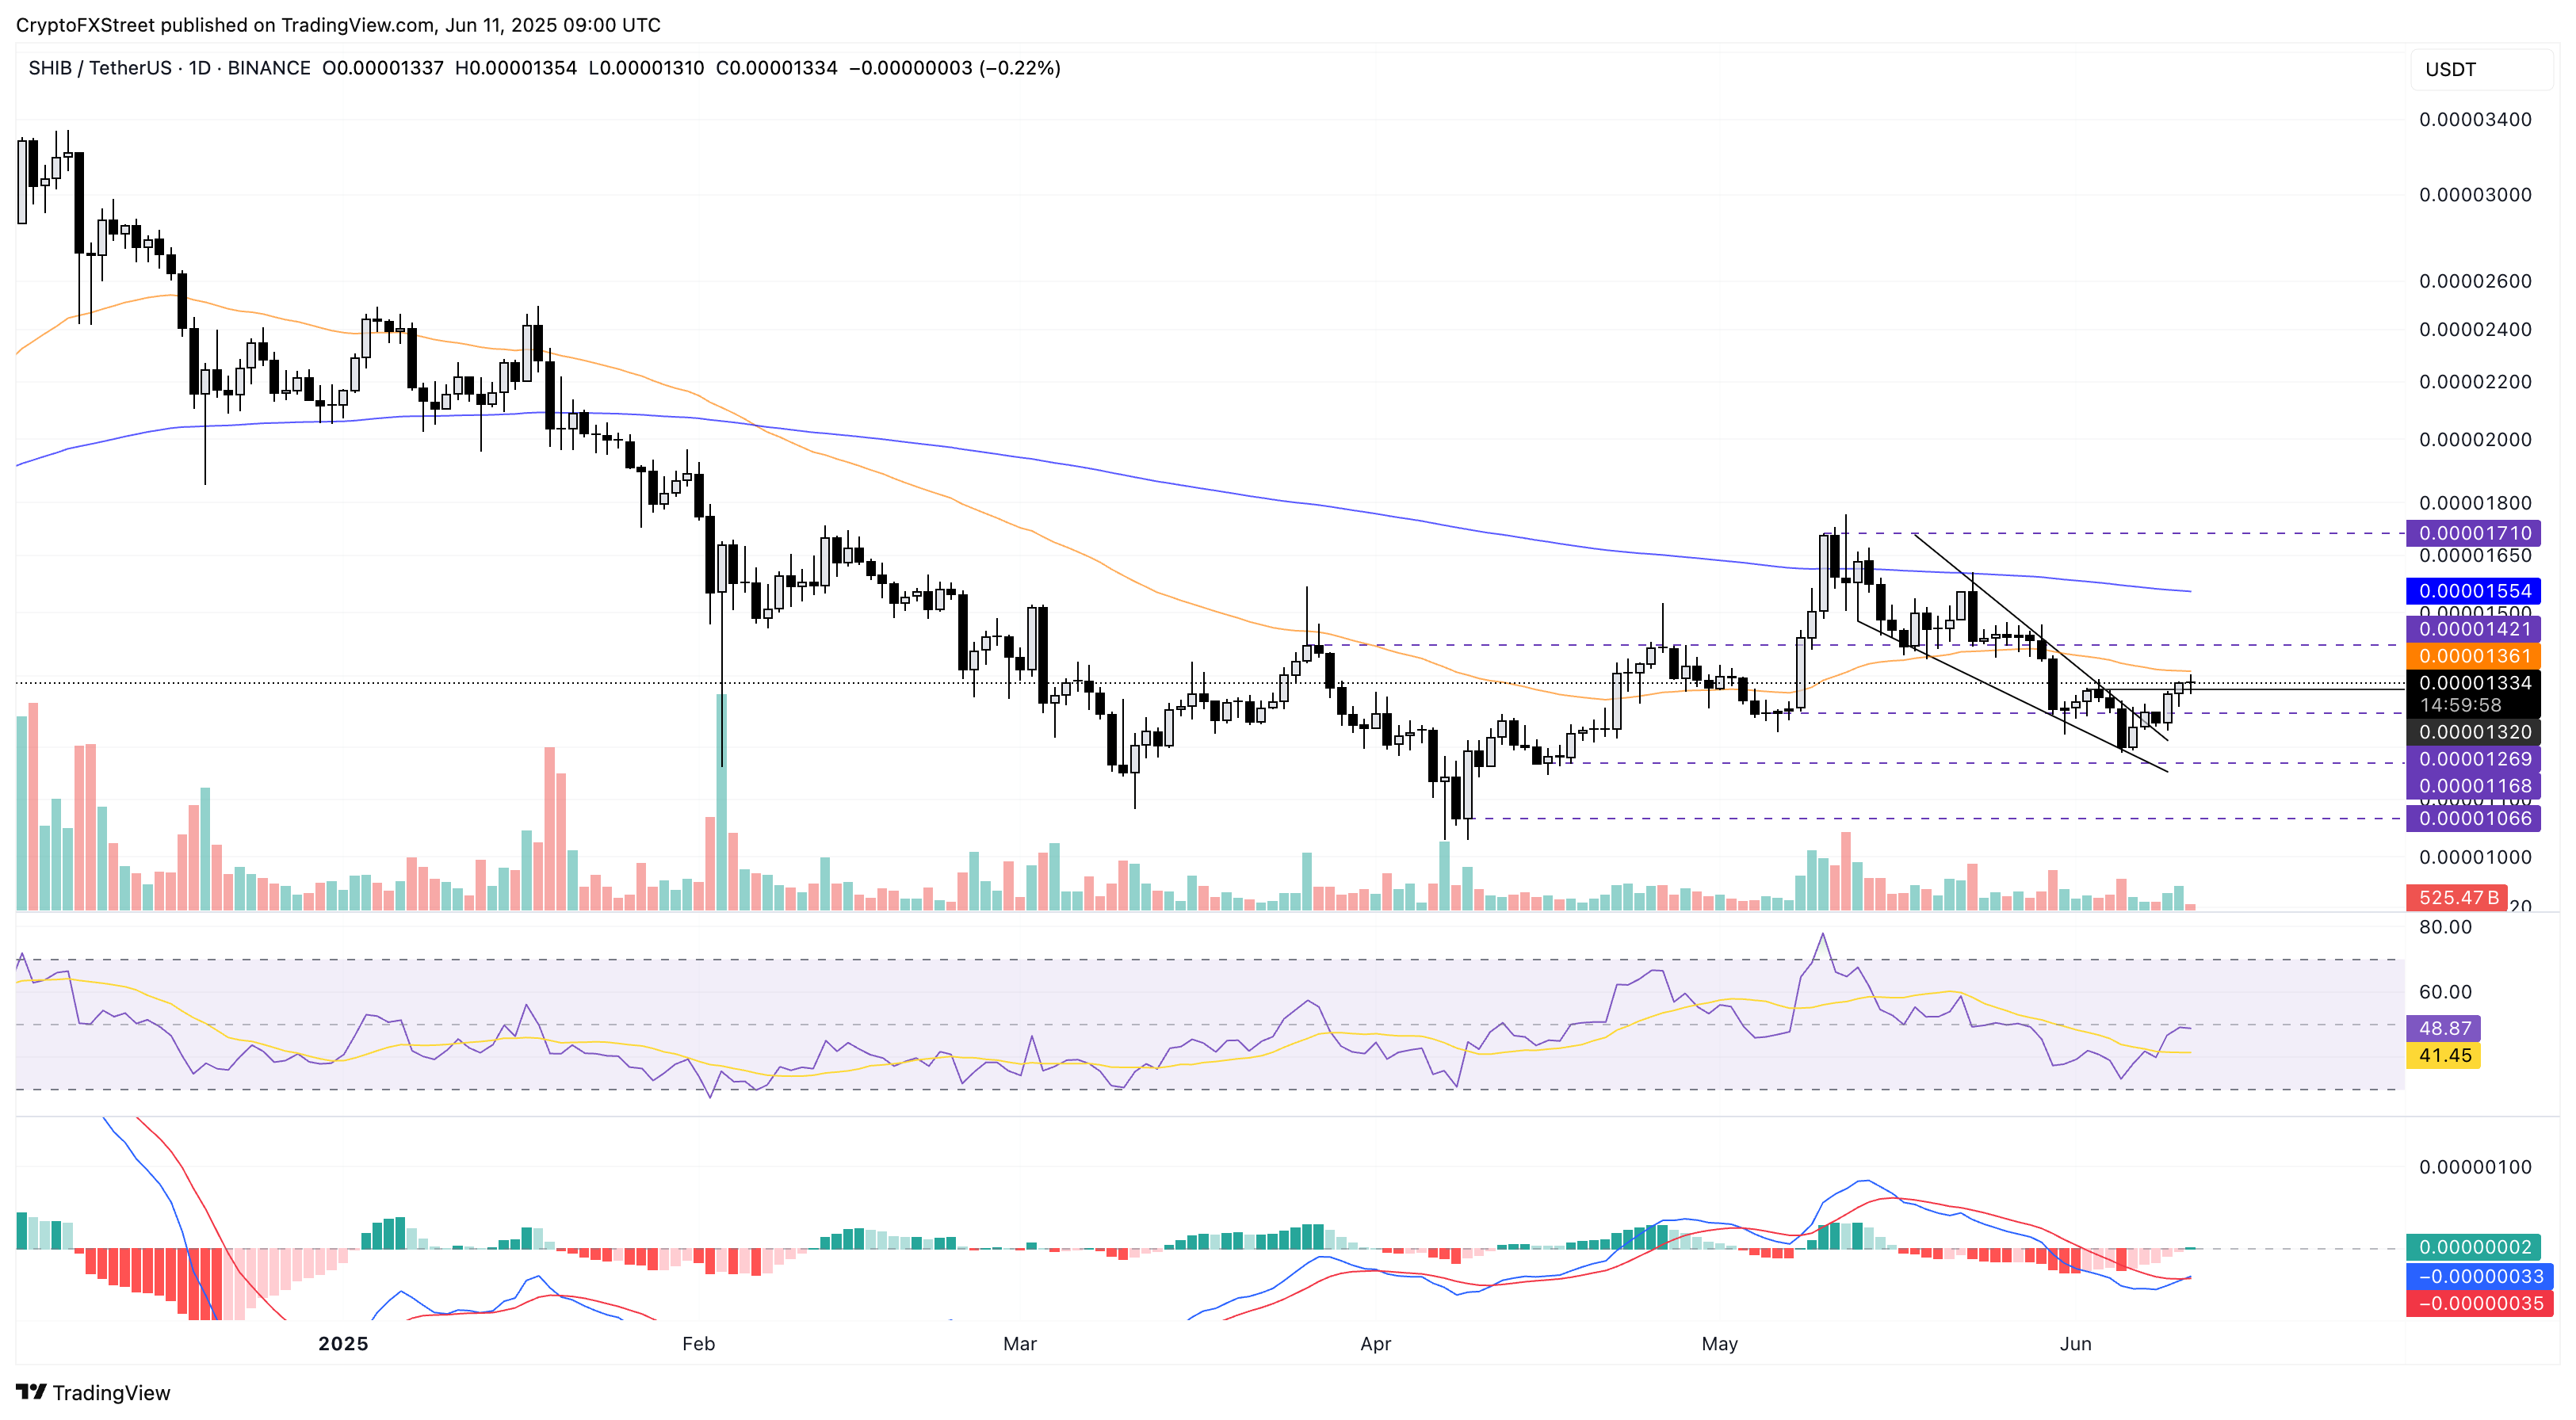
SHIB/USDT daily price chart.
Conversely, a failure to cross the 50-day EMA could result in a consolidation range or a pullback to $0.00001165 support marked by the low on April 15.
Pepe slows down after a sharp recovery
Pepe, the frog-themed meme coin, edged lower by around 3% at press time on Wednesday after five consecutive days of recovery.
The technical indicators on the daily chart ignore the minor intraday pullback and sustain an optimistic outlook. The MACD indicator and its signal line are approaching a bullish crossover, while the rising RSI indicator, currently at 54, experiences a minor downtick after crossing above the halfway line.
Considering the bullish trend continues, the uptrend could target the highest closing price in May at $0.00001550.
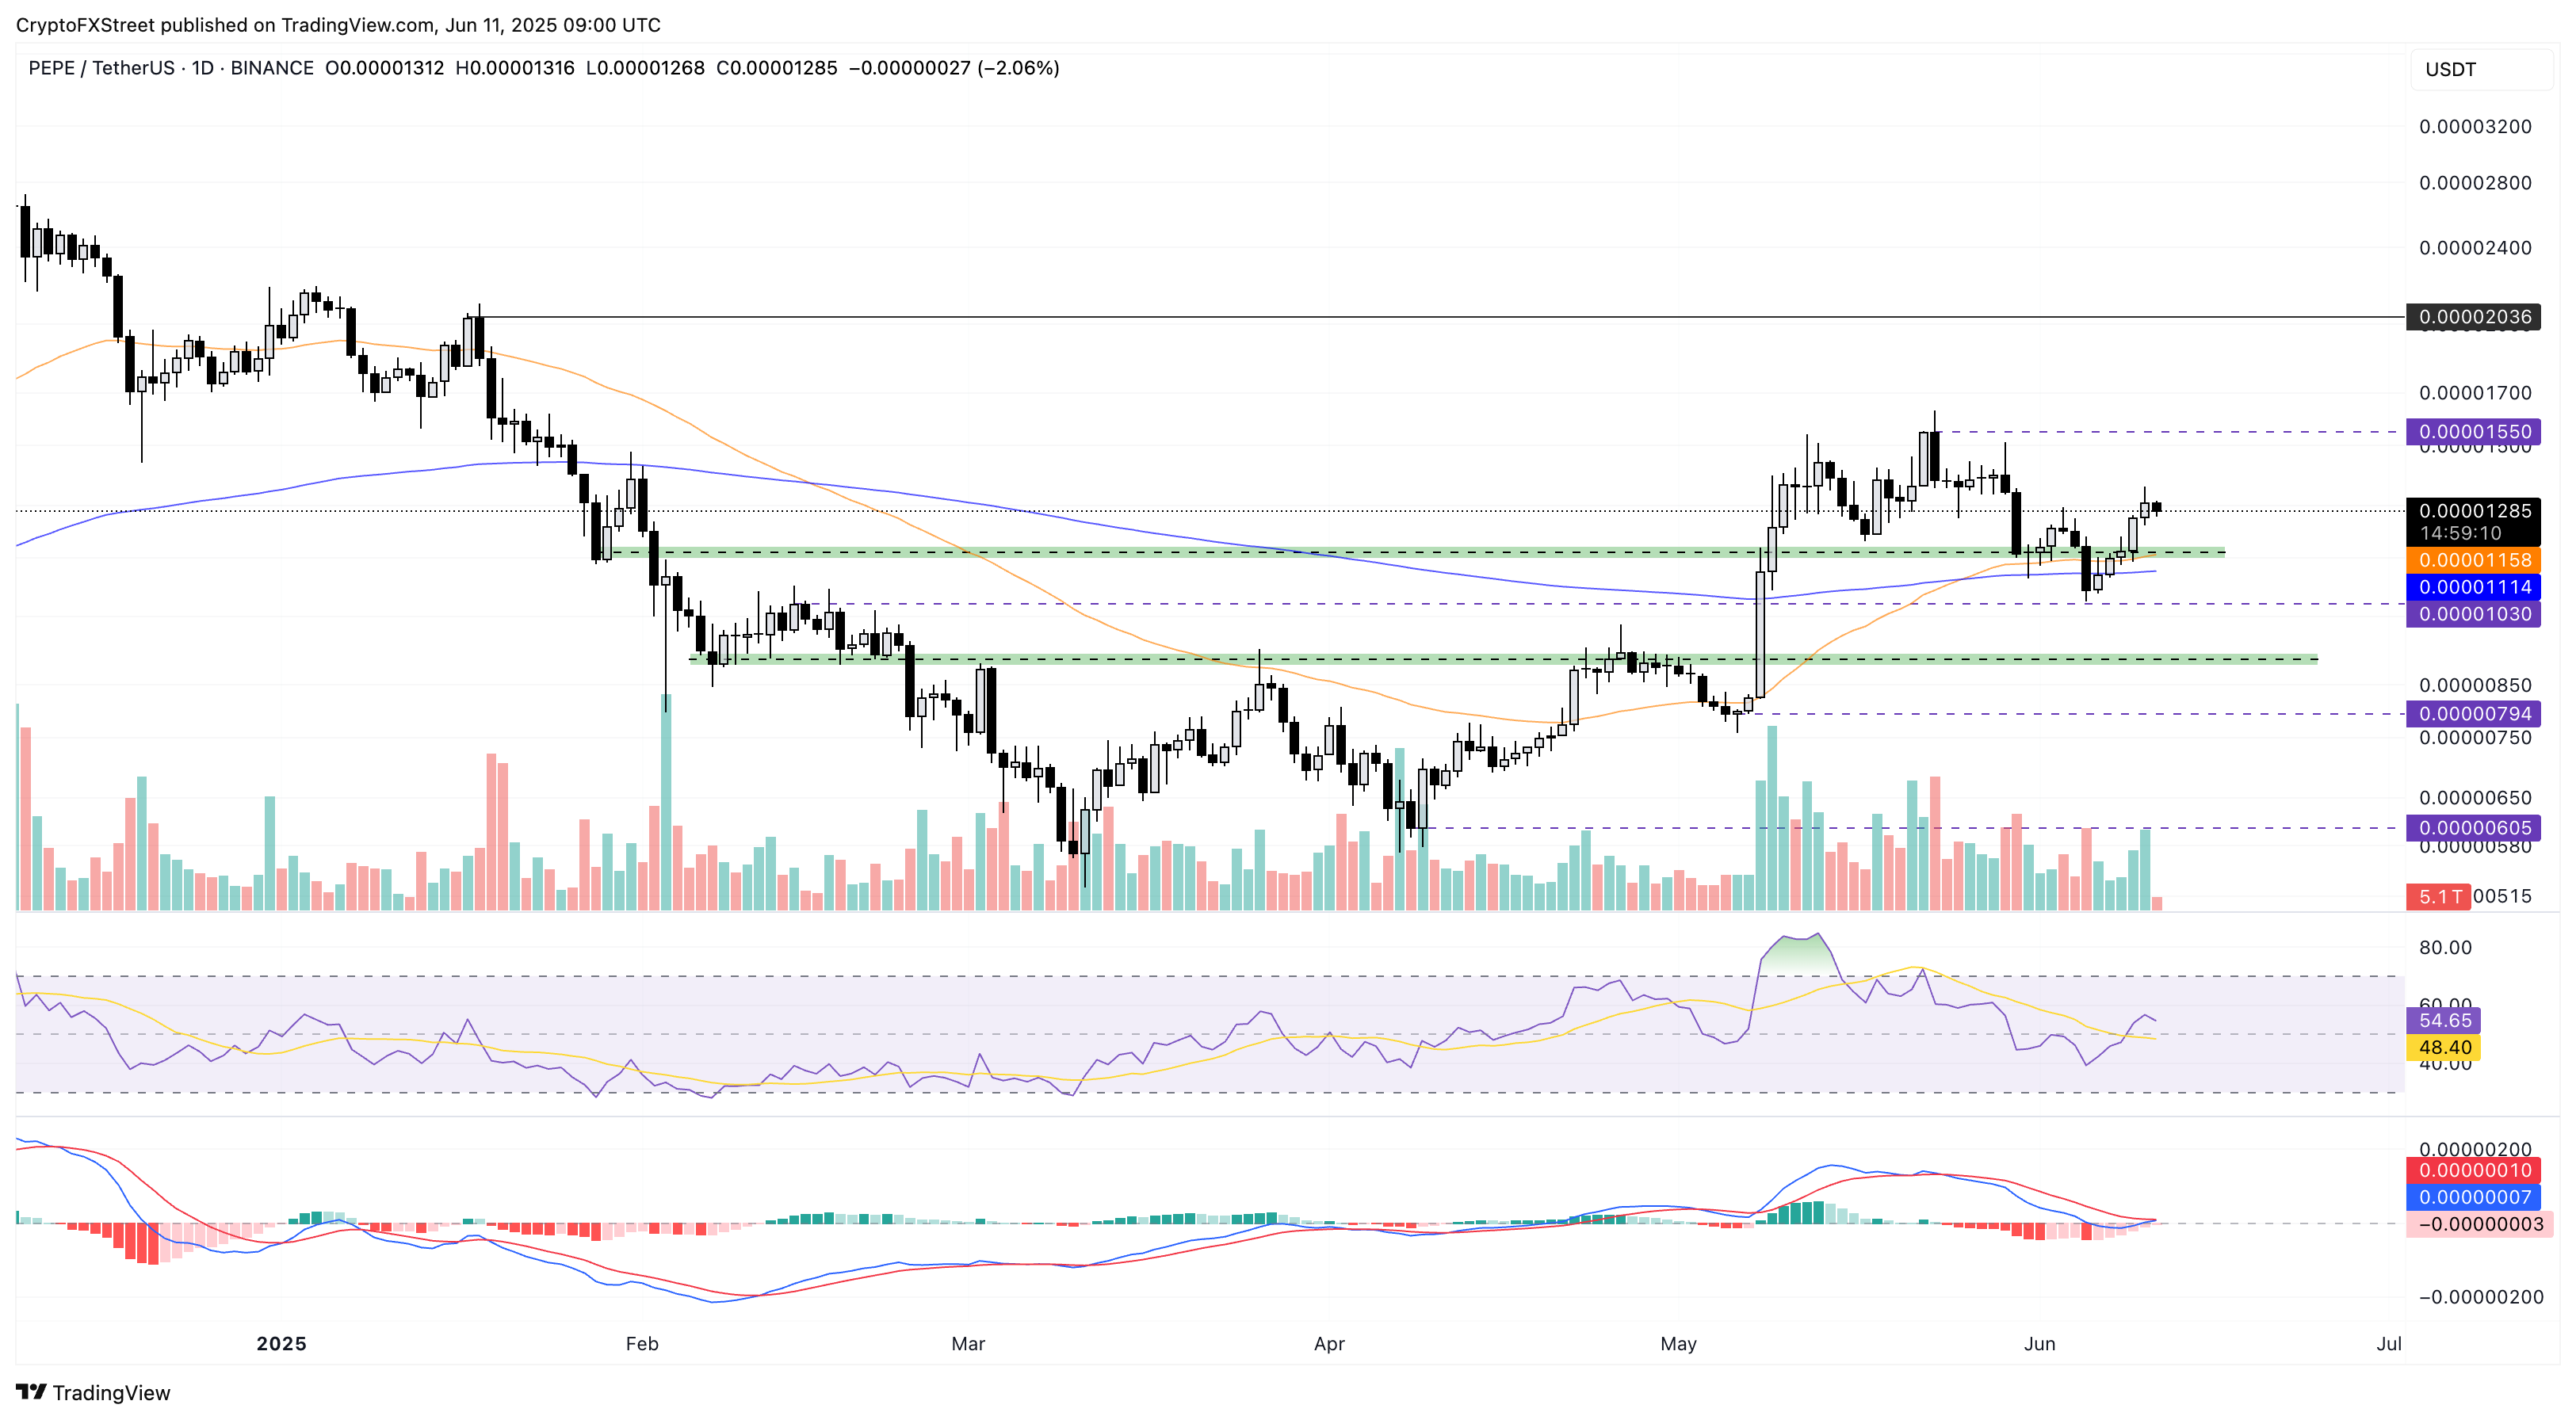
PEPE/USDT daily price chart.
On the other hand, a potential close below the 50-day EMA at $0.00001158 will undermine the recovery chances in Pepe. In such a case, the extended decline could target the $0.000010 psychological mark.
Recommended Articles


