


Crypto Today: Bitcoin, Ethereum, XRP wobble as recession fears resurface
- The cryptocurrency market capitalization drops 4% to $3.3 trillion amid growing concerns about tariffs and global trade.
- Bitcoin rebounds after testing support slightly above $100,000, reflecting weak sentiment in the broader crypto market.
- Ethereum and XRP struggle to maintain a critical bullish structure amid subdued recovery on Friday.
The cryptocurrency market trades amid weak sentiment and declining interest from traders, as well as retail and institutional investors. Bitcoin's (BTC) outlook has remained downside-heavy since reaching an all-time high of $111,980 on May 22. Meanwhile, the largest cryptocurrency by market capitalization hovers at around $103,477 at the time of writing on Friday, up almost 2% on the day following an over 3% drop on Thursday.
Leading altcoins Ethereum (ETH) and Ripple (XRP) have not been spared by the bearish wave crisscrossing the crypto market amid growing concerns about United States (US) tariffs, their impact on global trade and recession fears in the world's largest economy.
Market overview: Recession fears mount amid President Trump's tariffs
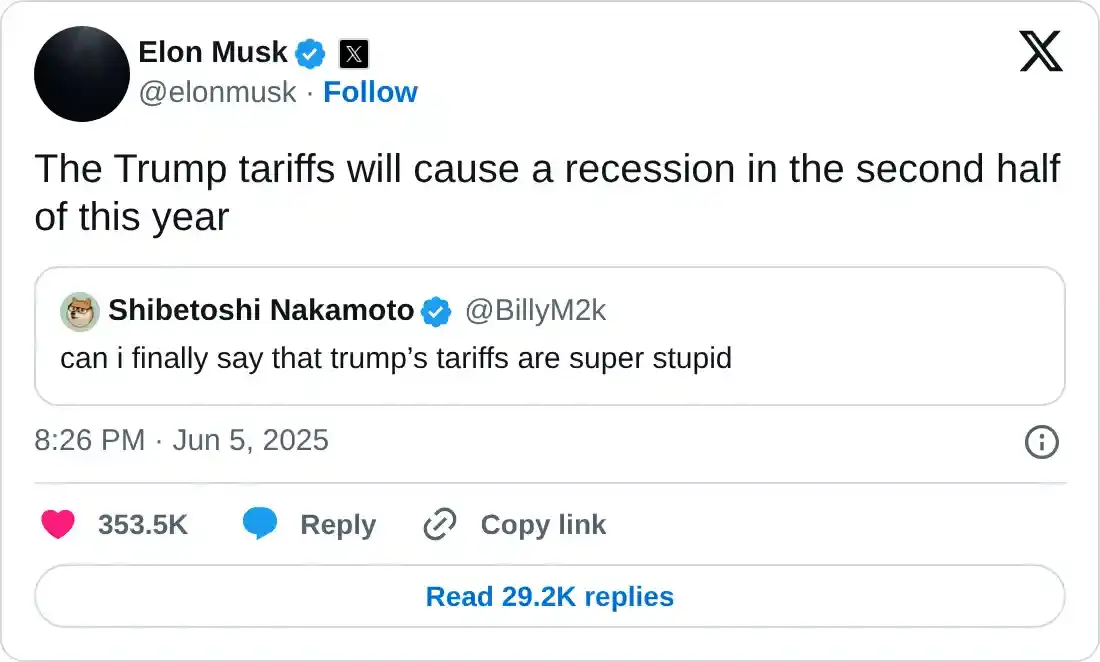
The fallout between US President Donald Trump and Tesla CEO Elon Musk has triggered the reemergence of recession fears. According to Musk, the US is treading on shaky ground, citing an escalating debt situation and high interest rate payments. The Tesla CEO warns that the tariffs being implemented by President Trump could lead to a recession during the second half of the year.
A recent note from Mike Wilson, Morgan Stanley's chief US equity strategist and CIO, pointed towards a mild recession. Wilson said that the trigger for the mild downturn could be a repeat of the April sell-off in summer or fall.
However, the bank believes that the recession will pave the way for a bullish run in US stocks, underpinned by likely rate cuts from the Federal Reserve (Fed) as well as potential resets in corporate earnings expectations.
"Given the rolling recessions we have already experienced and muted growth in much of the private economy over the past few years, we believe the decline in EPS would be more mild than during past recession," Wilson said in the note reported by Business Insider.
The cryptocurrency market remains lethargic amid the uncertainty surrounding US tariffs and, by extension, the reemergence of recession fears.
Chart of the day: Bitcoin shows signs of a rebound
Bitcoin found support slightly above $100,000 on Thursday after extending losses from all-time highs at around $111,980. The 50-day Exponential Moving Average (EMA) at $100,935 affirms the support, paving the way for gains above $103,000 at the time of writing.
Despite the downturn in price, Bitcoin sits significantly above the 100-day EMA at 96,773 and the 200-day EMA at $91,468, which highlights the support area marked in green on the daily chart below.
Traders will look for a break above the immediate $105,000 hurdle, with subsequent movement above the key resistance at $106,000 likely to bring higher resistance levels at $110,000 and the all-time high of $111,980 into focus.
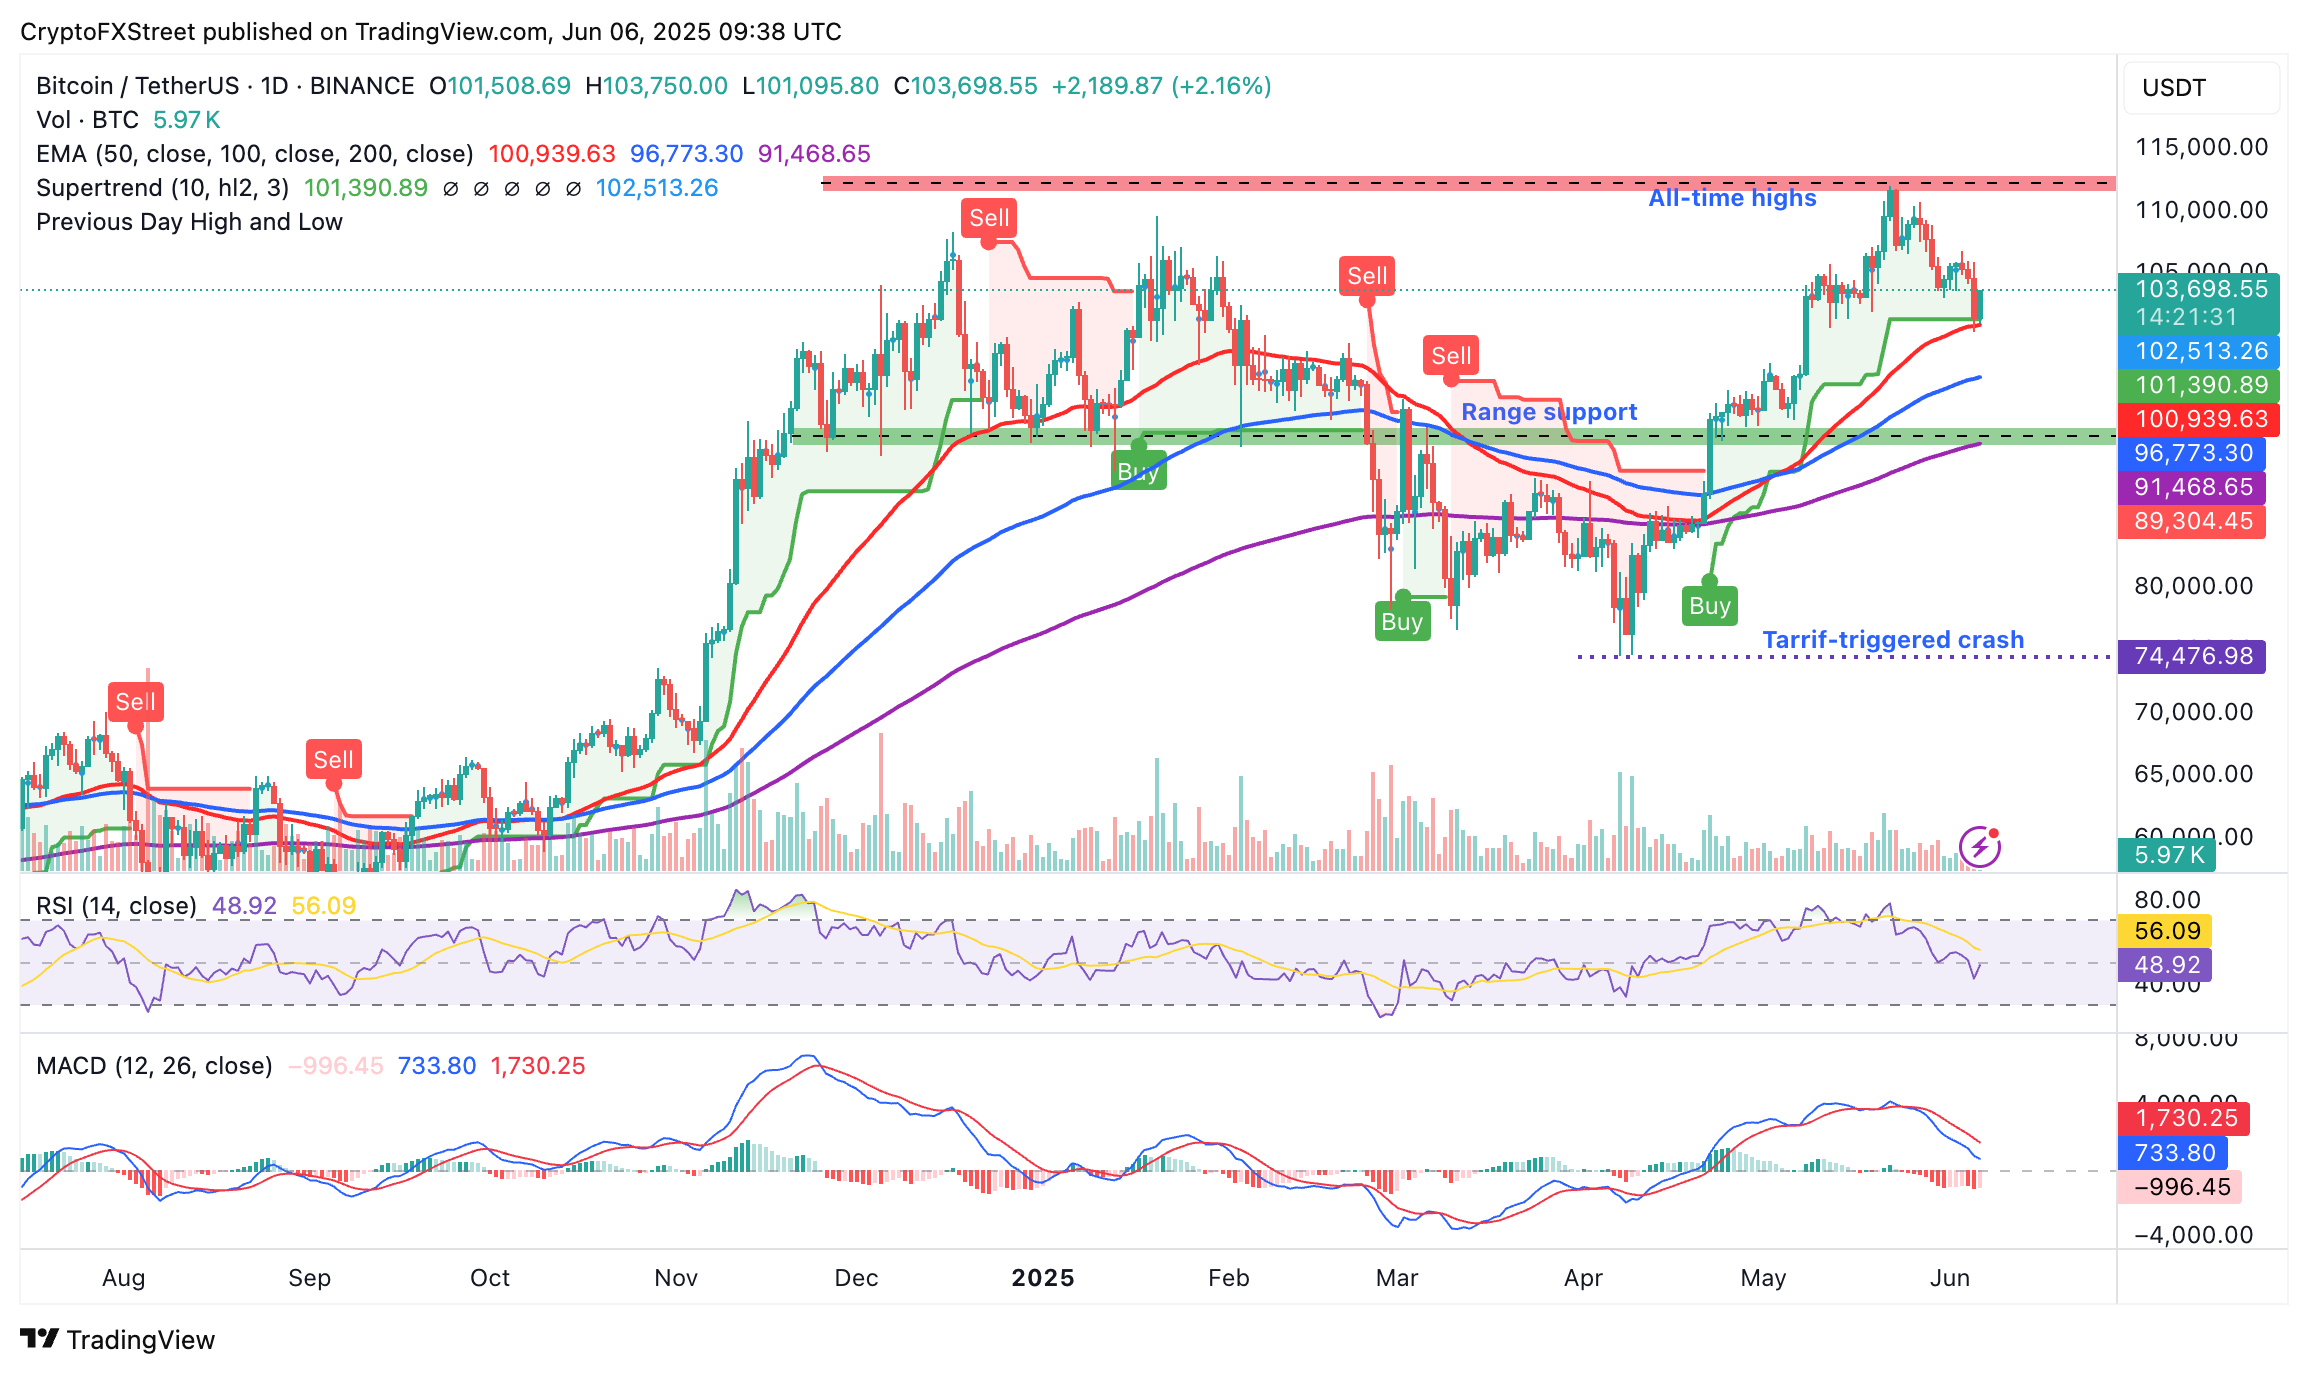
BTC/USDT daily chart
On the other hand, the sell signal from the Moving Average Convergence Divergence (MACD) indicator, highlighted by the MACD line crossing below the signal line last week, should not be ignored, as traders may still reduce their exposure to BTC amid the weak sentiment in the cryptocurrency market. Below $100,000, key areas of interest to traders are the 100-day EMA at $96,773 and the 200-day EMA at $91,468.
Altcoins update: Ethereum and XRP extend consolidation
Bitcoin's share of the total market capitalization is increasing despite the price downturn. Following the slump in mid-May, Bitcoin's dominance has surged over the last few weeks by more than 4% to 64.66%, making the anticipated altcoin season even more elusive. Based on the chart below, interest in Bitcoin is expected to increase in the upcoming weeks, potentially propelling its market capitalization as altcoins' share declines.
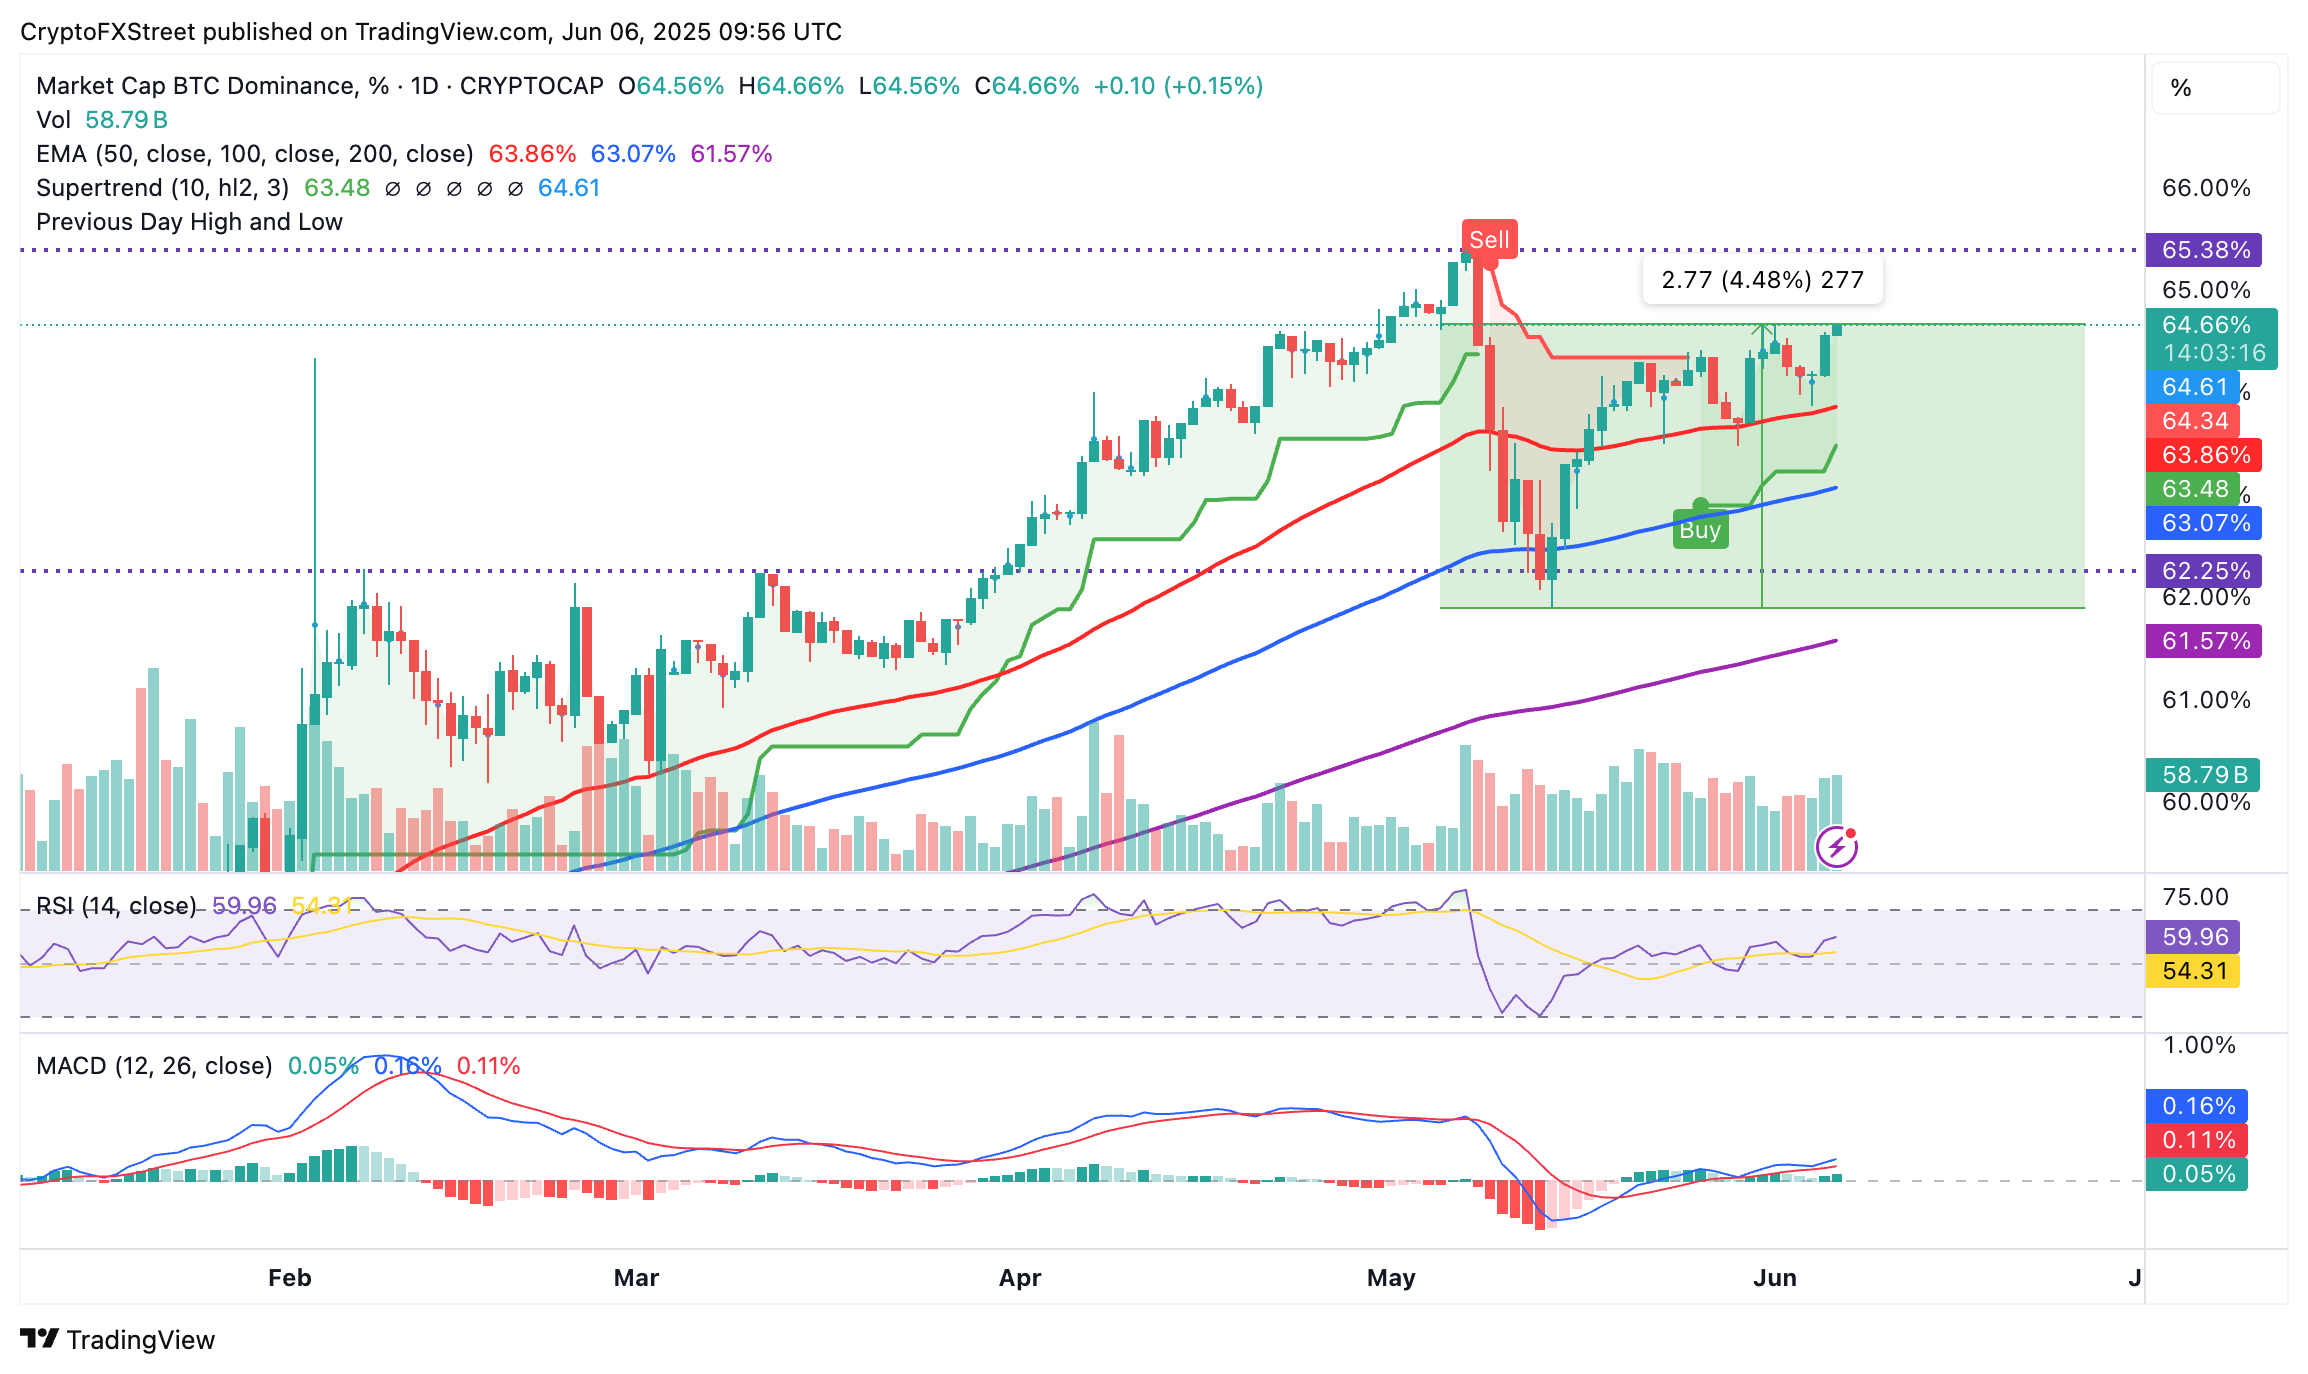
BTC.D daily chart
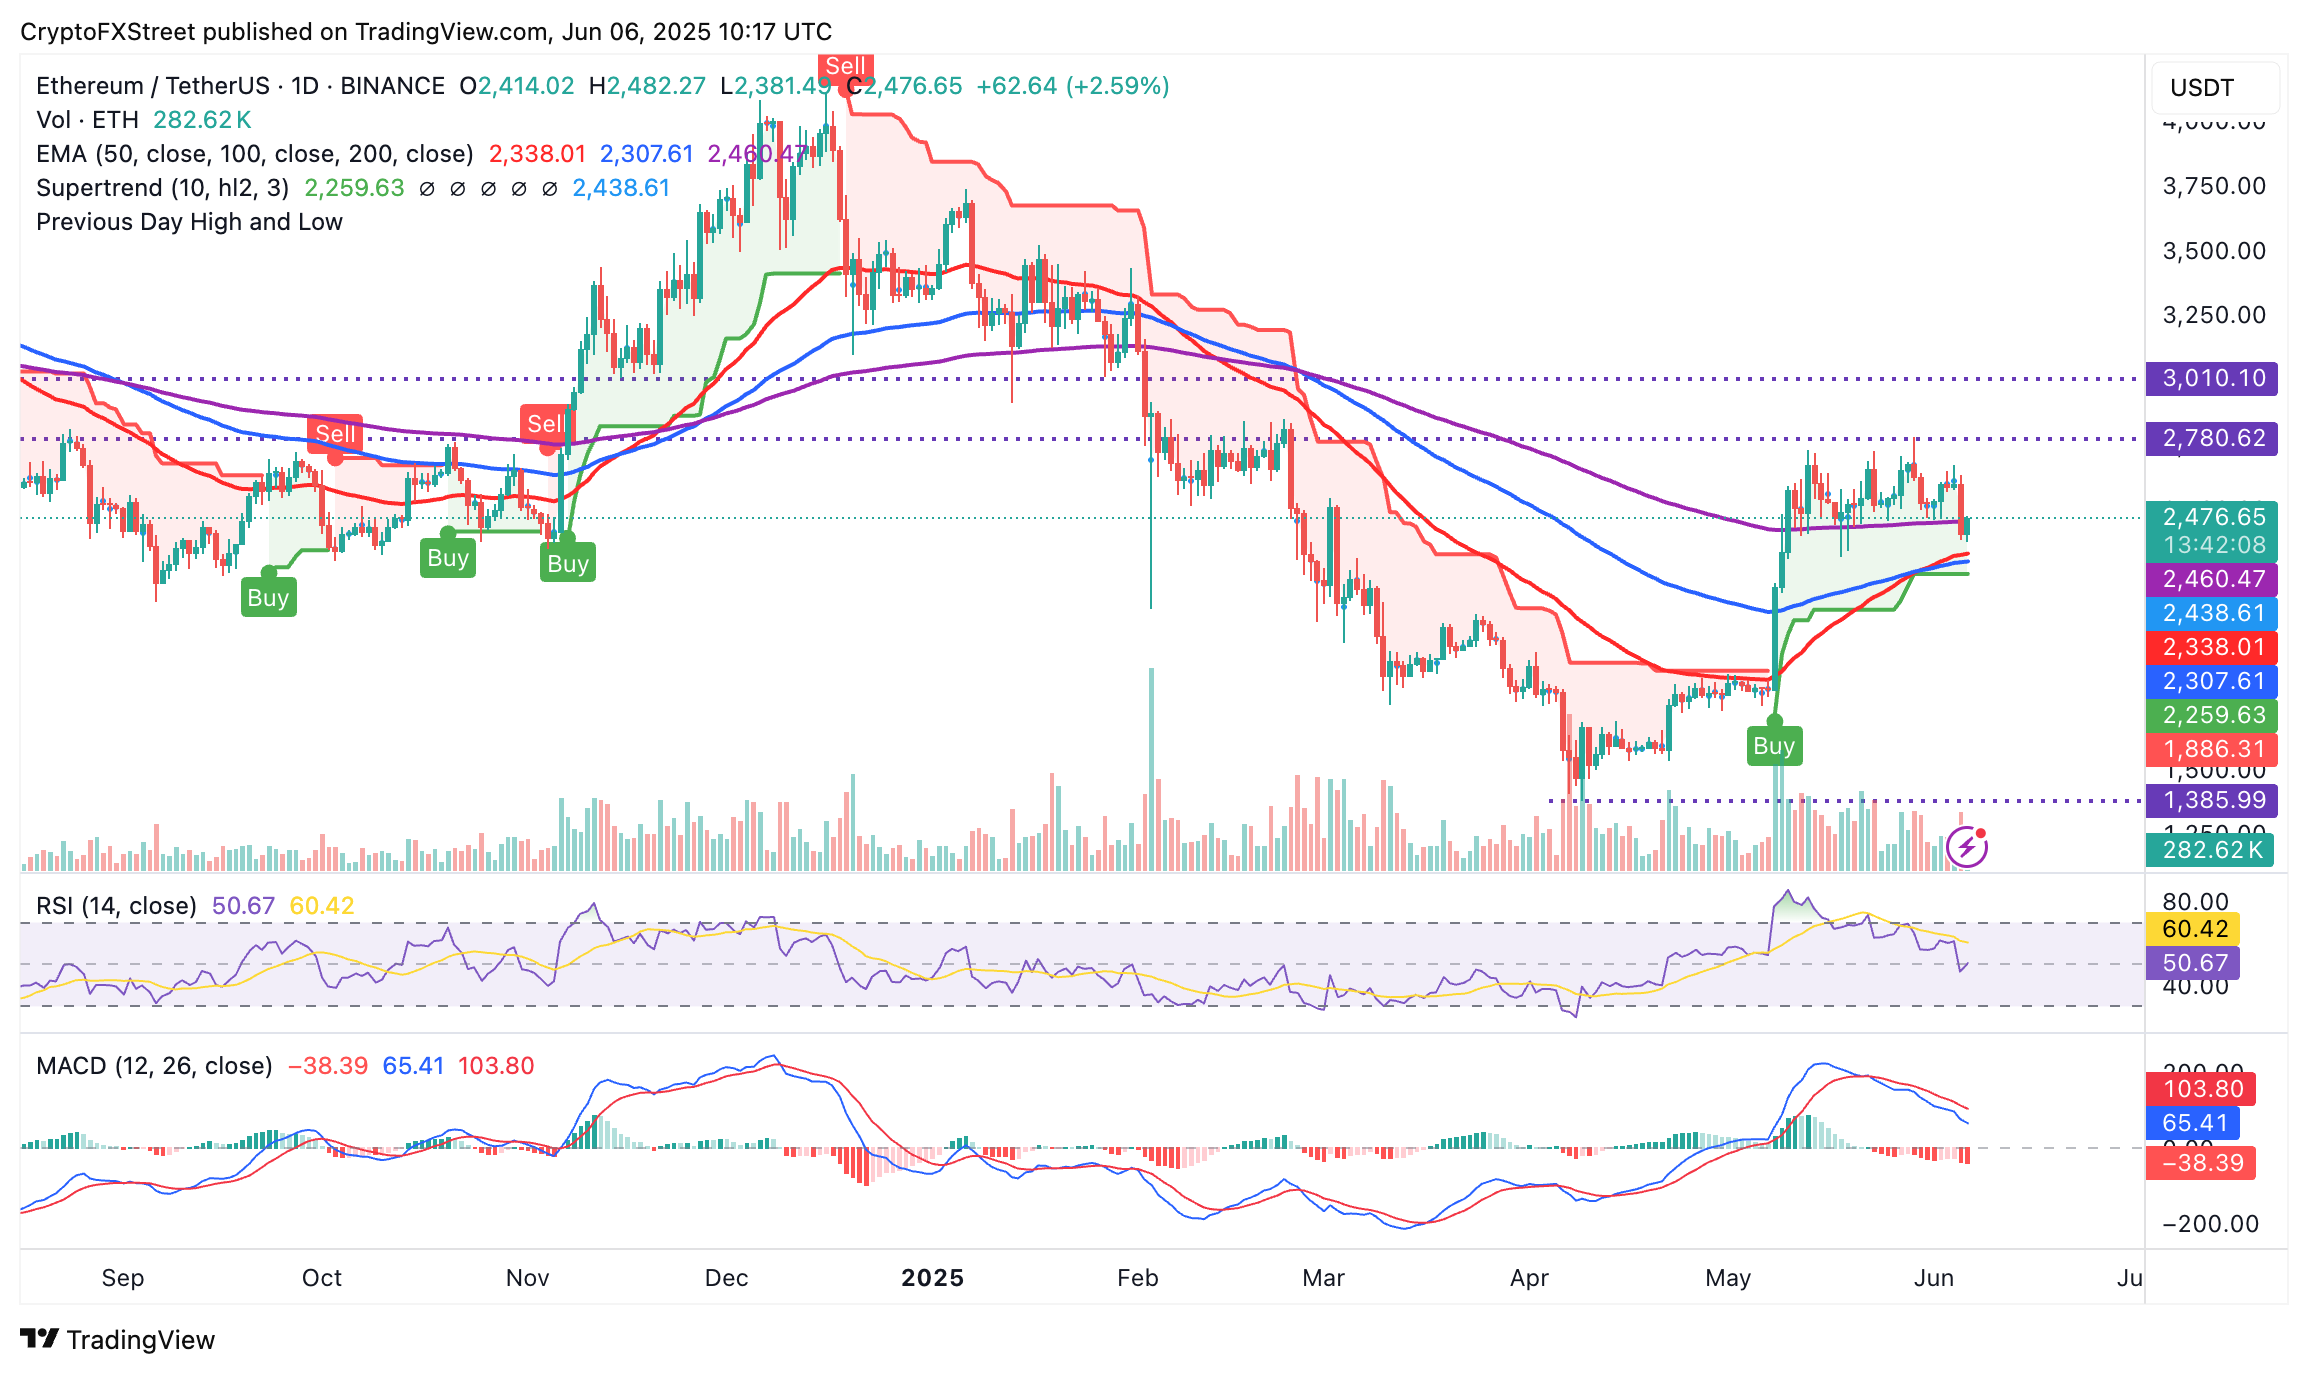
Meanwhile, Ethereum hovers at around $2,474 after nearly breaking below its narrow consolidation range support on Thursday. The smart contracts token upheld support at $2,382, paving the way for intraday gains exceeding 2% on the day.
Traders would look for a daily close above the 200-day EMA, which lies at $2,460, to validate the uptrend. However, a break above the consolidation range limit at around $2,780 could prompt traders to expand their scope toward the psychological resistance level at $3,000.
ETH/USD daily chart
On the other hand, XRP edges higher from the support provided by the 200-day EMA, currently at around $2.08, and trades around $2.14 at the time of writing on Friday. The uptrending Relative Strength Index (RSI) is approaching the 50 midline, signaling decreasing bearish momentum.
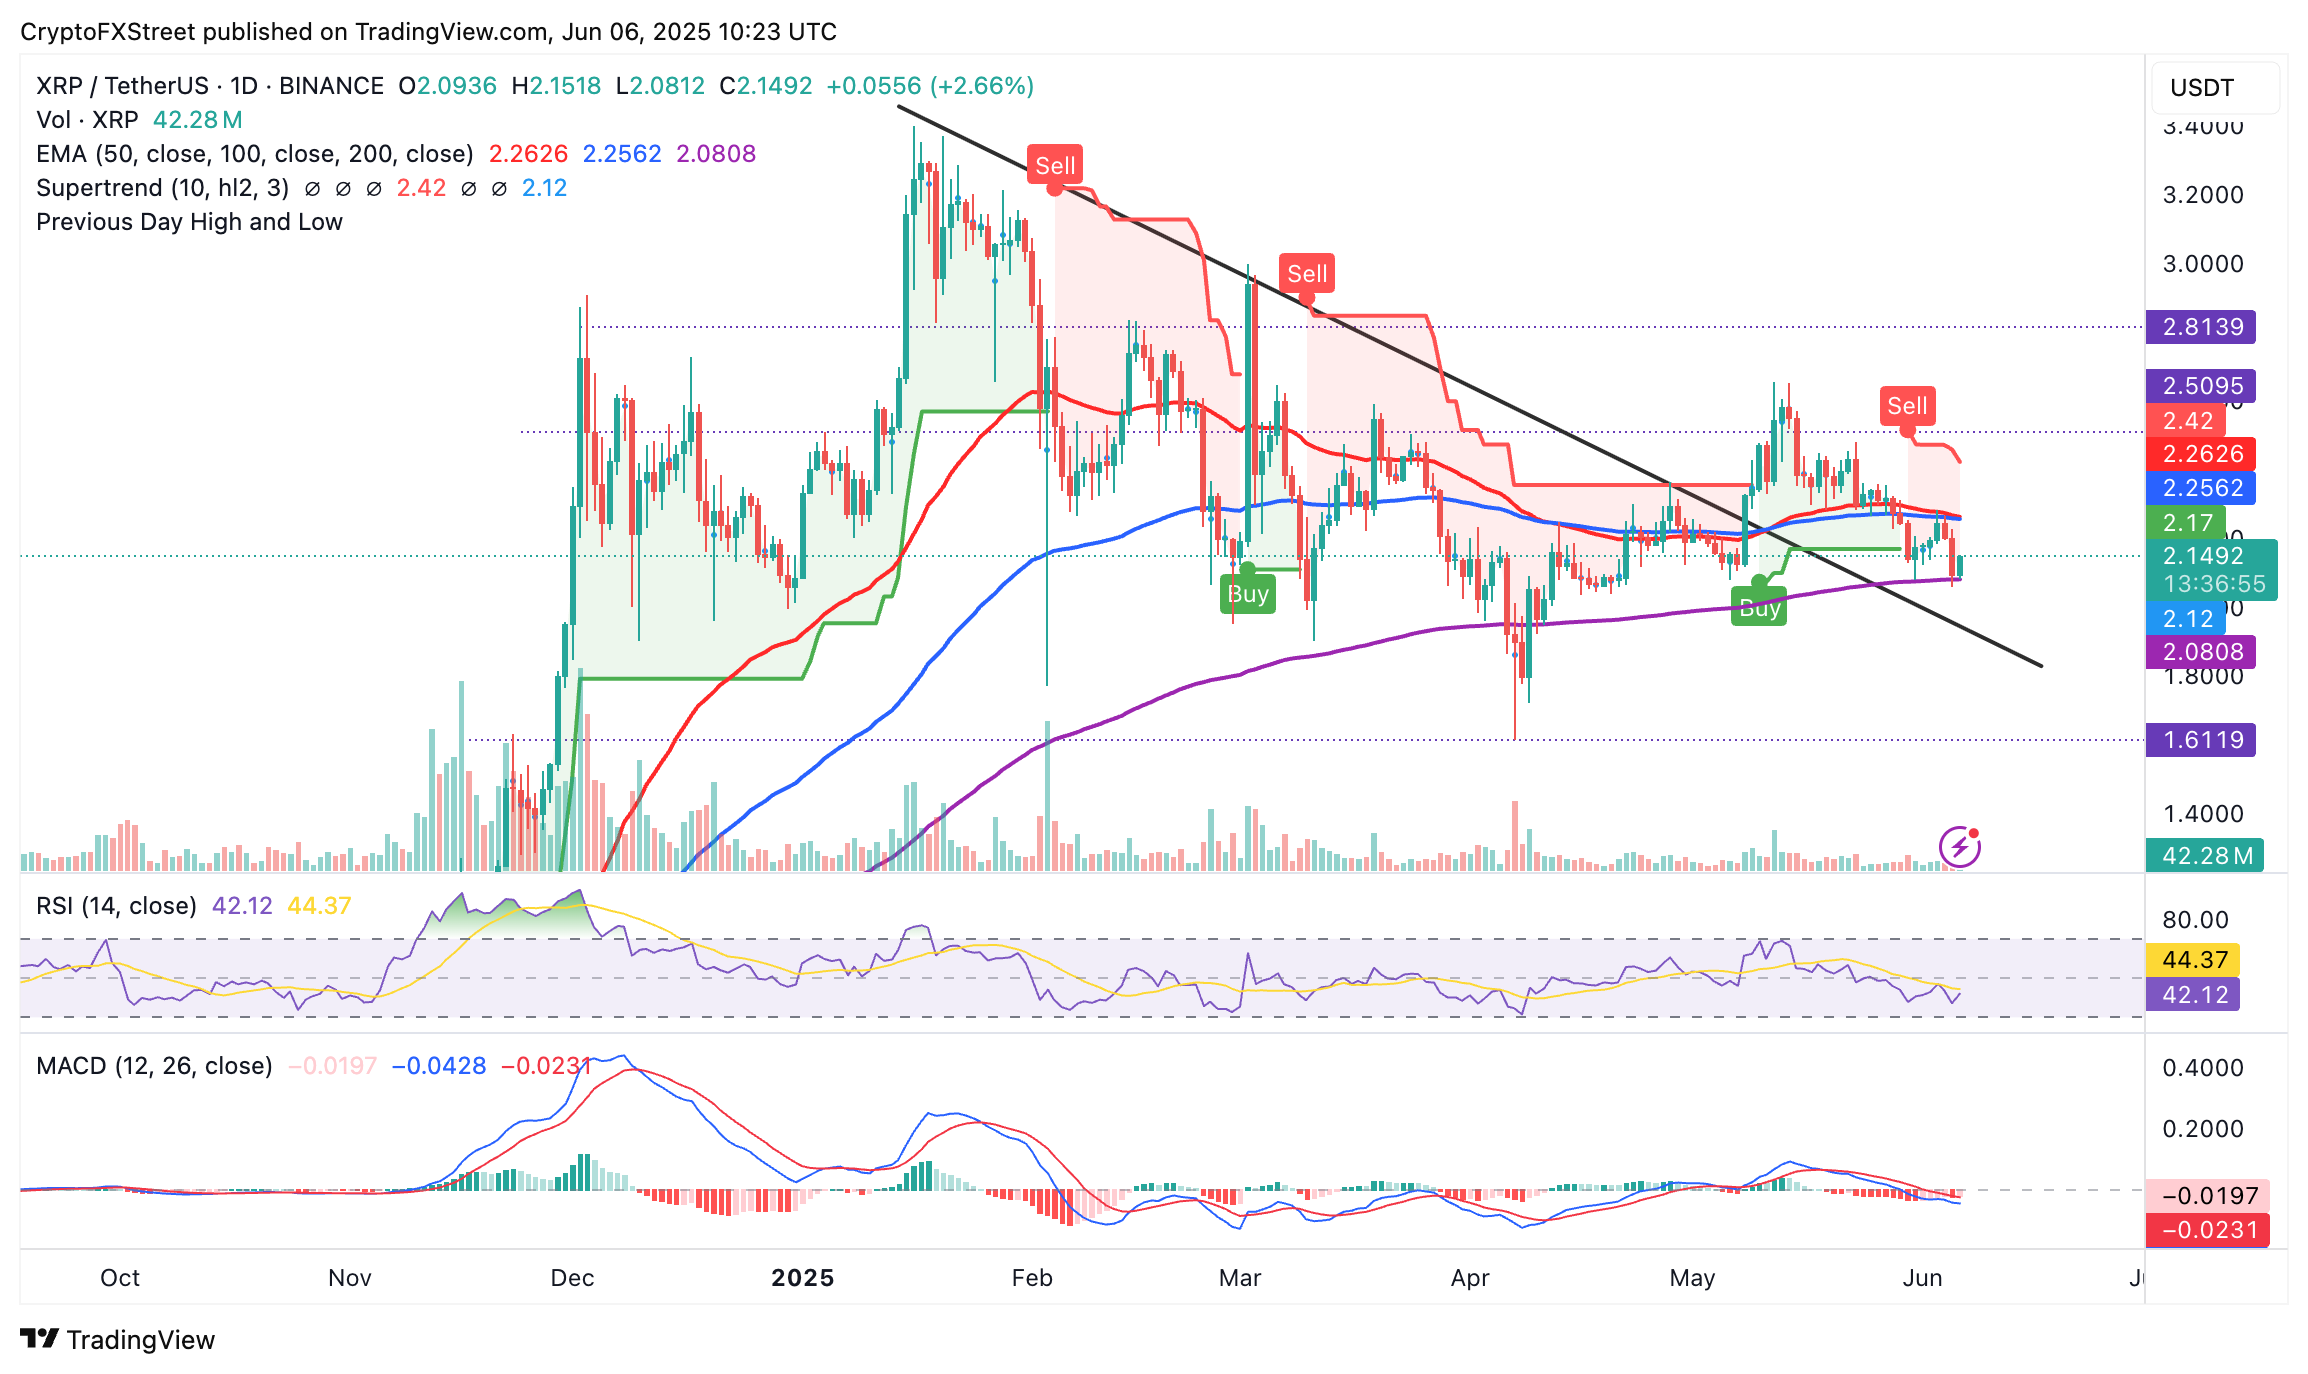
XRP/USDT daily chart
However, traders should exercise caution ahead of the weekend, especially with the seller congestion at around $2.26, established by the 50-day EMA and the 100-day EMA. A sell signal from the SuperTrend indicator, sent on May 30, indicates heightened volatility in the market, which could extend the downtrend below support at $2.08.
Cryptocurrency prices FAQs
Token launches influence demand and adoption among market participants. Listings on crypto exchanges deepen the liquidity for an asset and add new participants to an asset’s network. This is typically bullish for a digital asset.
A hack is an event in which an attacker captures a large volume of the asset from a DeFi bridge or hot wallet of an exchange or any other crypto platform via exploits, bugs or other methods. The exploiter then transfers these tokens out of the exchange platforms to ultimately sell or swap the assets for other cryptocurrencies or stablecoins. Such events often involve an en masse panic triggering a sell-off in the affected assets.
Macroeconomic events like the US Federal Reserve’s decision on interest rates influence crypto assets mainly through the direct impact they have on the US Dollar. An increase in interest rate typically negatively influences Bitcoin and altcoin prices, and vice versa. If the US Dollar index declines, risk assets and associated leverage for trading gets cheaper, in turn driving crypto prices higher.
Halvings are typically considered bullish events as they slash the block reward in half for miners, constricting the supply of the asset. At consistent demand if the supply reduces, the asset’s price climbs.
Recommended Articles


