


Hedera Falls 10% In a Week As HBAR Price Seeks New Support Levels
Hedera (HBAR) is under pressure, down 3.6% in the last 24 hours and 13.6% over the past week. Its price is struggling below $0.21 and hovering near $0.185. Market cap has dropped below $8 billion, reflecting weakening sentiment.
Momentum indicators like RSI and BBTrend are bearish, and a possible EMA death cross adds to downside risk. HBAR is now at a key level where holding support could prevent further losses.
HBAR Momentum Fades as BBTrend Holds Below Zer
Hedera’s BBTrend has fallen to -8.88, turning negative at the end of May 16 after maintaining positive territory from May 11 to May 16.
Since then, the indicator has remained consistently bearish, hovering between -8 and -8.5 over the past day.
This sustained drop suggests that bullish momentum has fully faded, and HBAR is now experiencing stronger downside pressure.
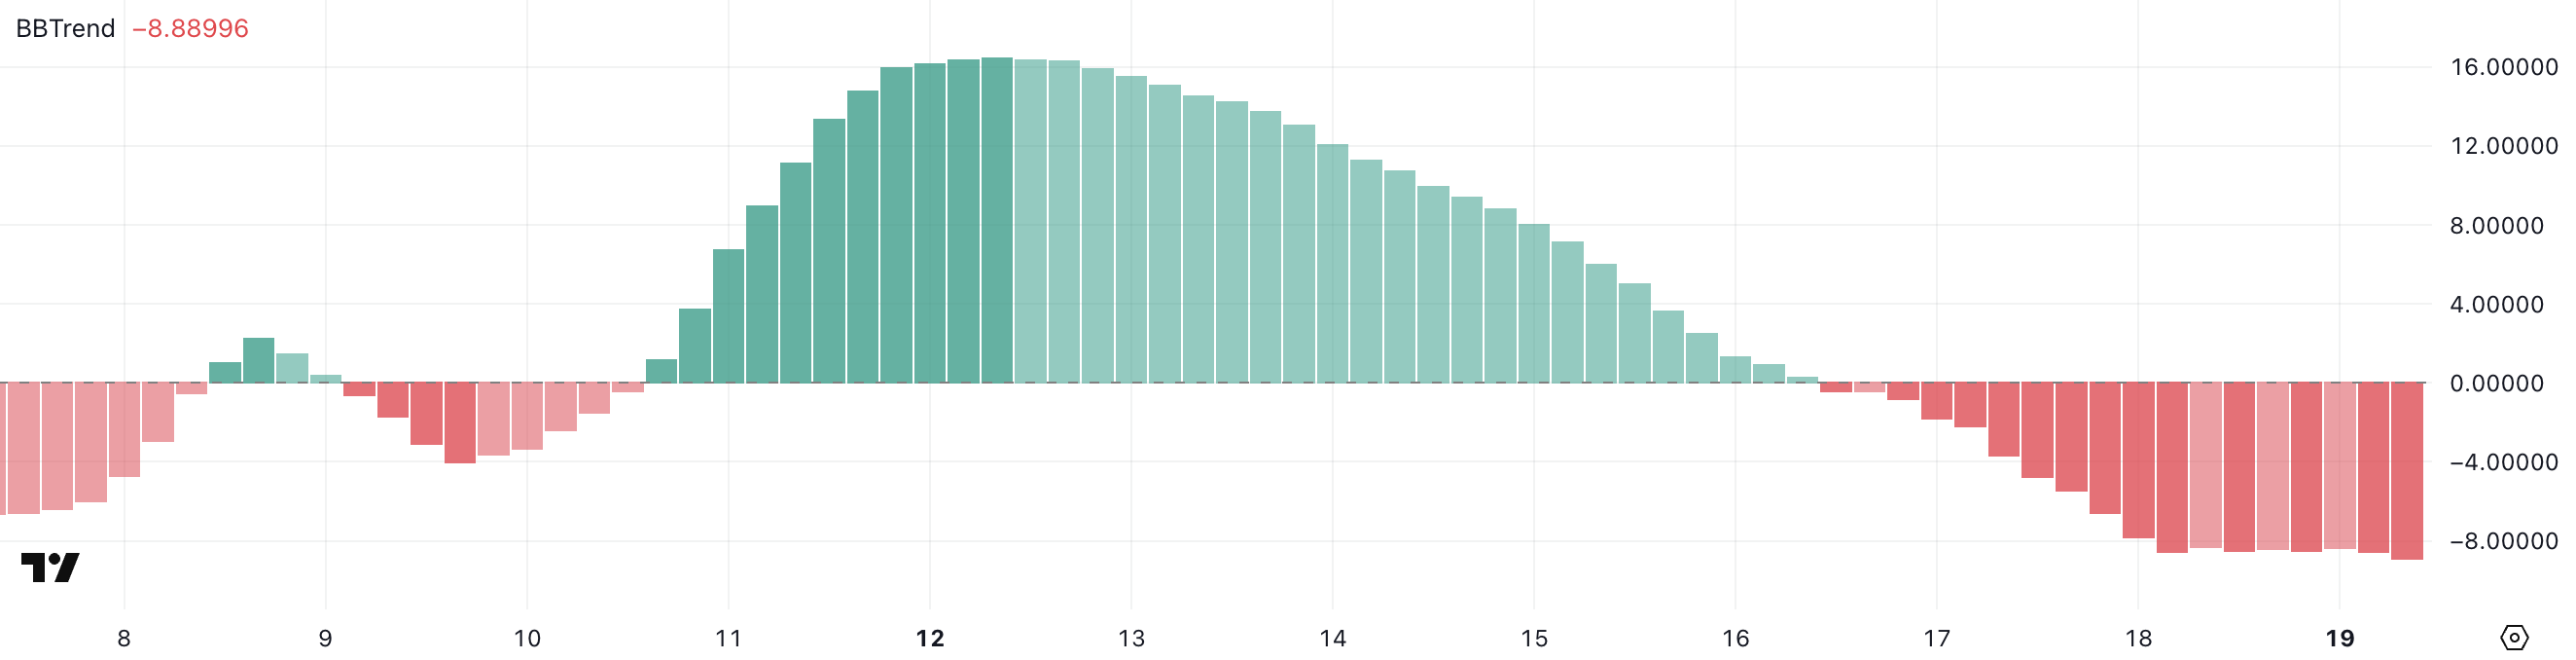 HBAR BBTrend. Source: TradingView.
BBTrend, or Bollinger Band Trend, gauges the strength and direction of price movements by analyzing how far price deviates from its average relative to volatility.
Positive values typically signal bullish momentum, while negative values suggest bearish conditions. With HBAR’s BBTrend now deeply negative at -8.88, the token may be entering a weakening trend phase.
Unless the trend reverses soon, this level indicates that HBAR could continue to face difficulty breaking resistance or regaining upward momentum.
Hedera RSI Fails to Hold Recovery, Slips Back Into Bearish Zone
Hedera’s RSI is currently at 39, reflecting a loss of momentum after a brief recovery attempt. Two days ago, RSI hovered near the oversold threshold at 30.92, suggesting that HBAR had been under strong selling pressure.
It rebounded sharply to 53.54 yesterday, briefly entering neutral territory, but quickly slipped back down to 39—highlighting that the bounce was short-lived.
This kind of volatility in the RSI often points to a lack of conviction from buyers, with sellers still dominating the market in the short term.
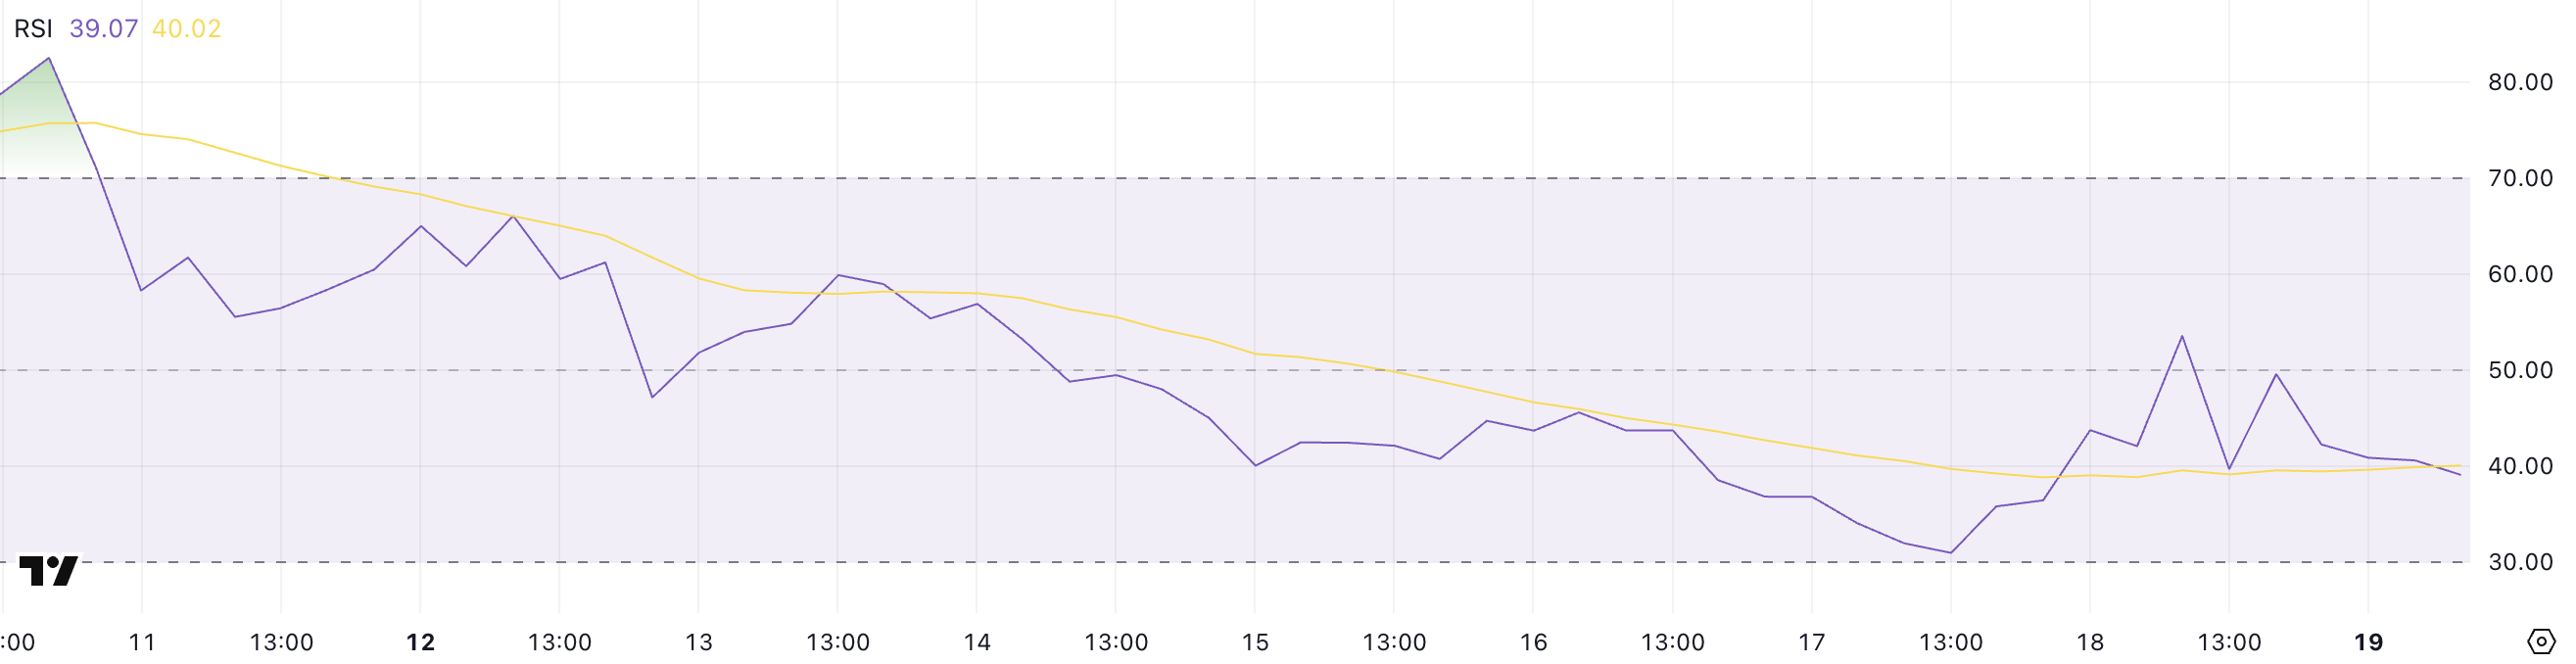 HBAR RSI. Source: TradingView.
The Relative Strength Index (RSI) is a momentum indicator that ranges from 0 to 100, commonly used to evaluate whether an asset is overbought or oversold.
Readings above 70 suggest overbought conditions and potential for a pullback, while values below 30 imply the asset may be oversold and ripe for a bounce. At 39, Hedera’s RSI sits in bearish territory—above the oversold zone but still far from signaling strong buying pressure.
This mid-low level suggests caution among traders. Unless RSI can reclaim the 50 level and hold, HBAR may continue to face downside risk or stagnate without a clear trend reversal.
HBAR Faces Make-or-Break Moment Near $0.185
Hedera price is trading near a critical support level at $0.185, with its EMA lines signaling a potential death cross. In this event, short-term moving averages cross below long-term ones, often associated with the start of a deeper downtrend.
If this bearish crossover occurs and the $0.185 support fails to hold, HBAR could slide further to $0.169.
A breakdown below that would expose the token to additional losses, with $0.160 as the next major support. Should selling pressure accelerate, a move below $0.160 cannot be ruled out, especially in a sustained bearish environment.
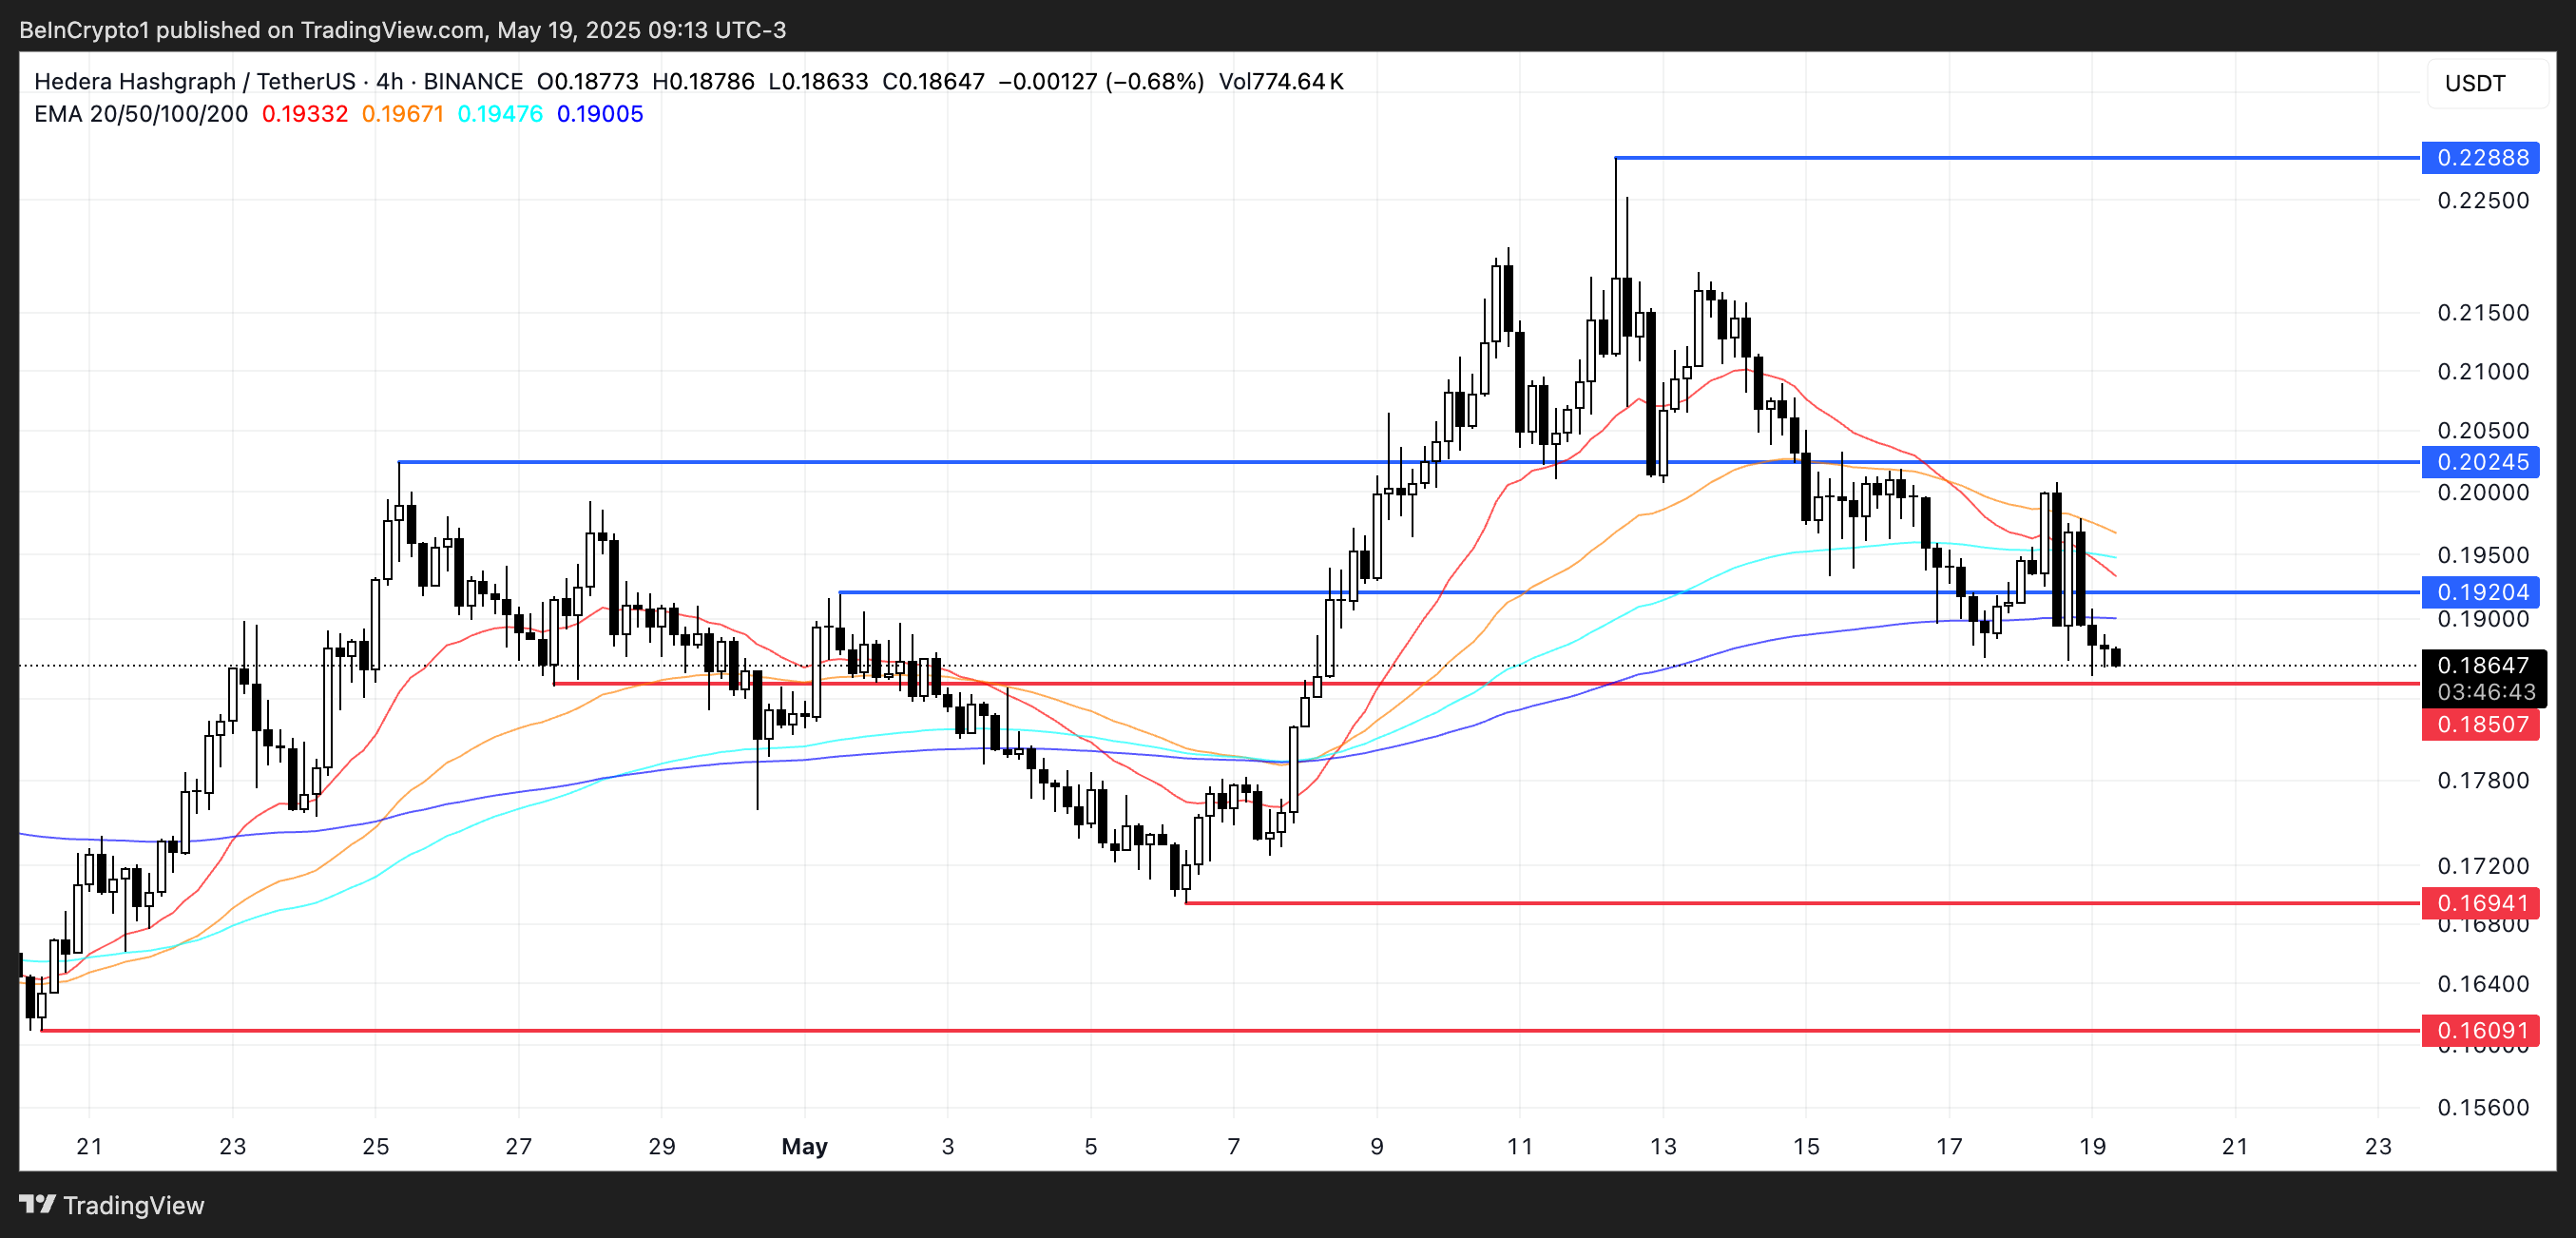 HBAR Price Analysis. Source: TradingView.
On the flip side, if HBAR manages to hold above $0.185 and avoid triggering the death cross, it could find renewed buying interest.
A successful defense of support would open the door for a retest of the $0.192 resistance level.
A breakout there could push HBAR toward $0.202, and if momentum builds, it may even reach as high as $0.228.
Recommended Articles


