


Bitcoin Price Could Be Preparing For Fresh Wave Of Volatility — Here’s Why
The Bitcoin price action over the weekend has been quite sluggish, reflecting the indecision and fatigue seemingly hovering over the cryptocurrency market at the moment. After a dour performance during the week, the premier cryptocurrency has continued to trade within the $92,000 – $95,000 range on Saturday, May 17.
With the choppy price action, doubt about the Bitcoin price reclaiming its all-time high of $108,786 is starting to creep in. However, the latest on-chain data suggests that the market leader could be gearing up for significant price movements over the next few weeks.
Open Interest Metric Predicts What’s Next For BTC Price
In a recent post on the X platform, blockchain analytics firm Alphractal delved into fresh on-chain observations revolving around the price of Bitcoin and the open interest (OI) cycle. According to the market intelligence firm, the BTC open interest data is exhibiting certain patterns that have coincided with major price moves in the past.
Typically, the open interest metric measures the total amount of money flowing into BTC derivatives at any given period. Meanwhile, the OI Delta indicator estimates changes in the open interest over a specific timeframe.
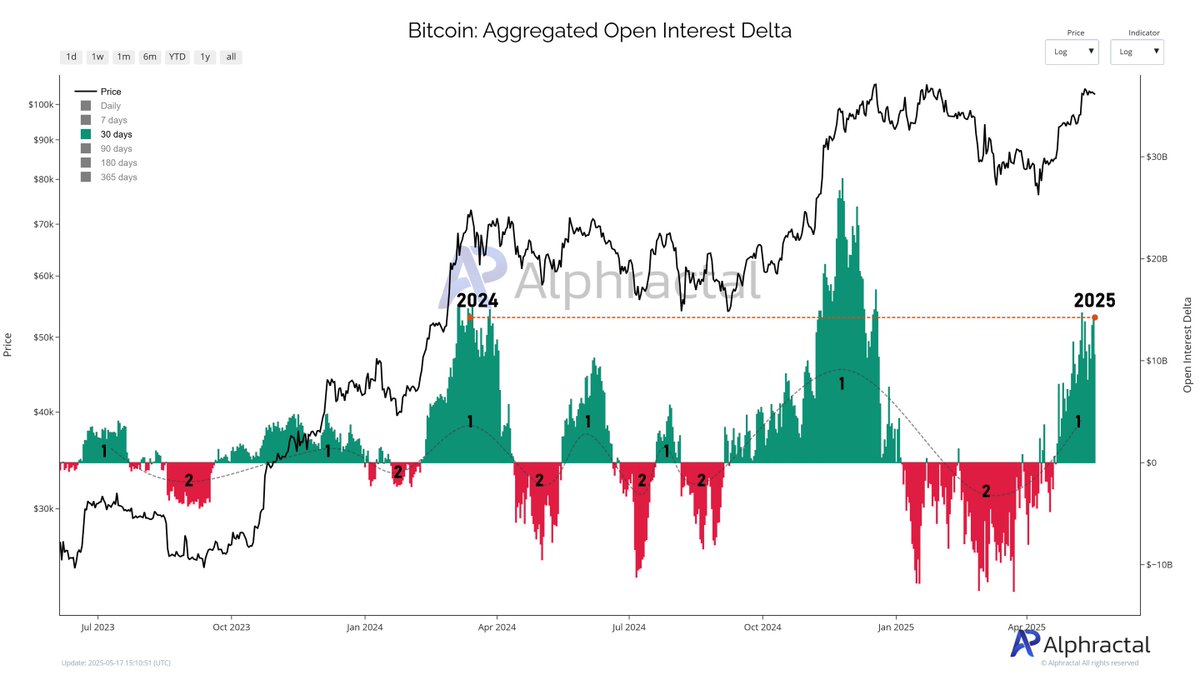
Firstly, Alphractal highlighted that the 30-day Open Interest Delta recently reached the same levels seen during the Bitcoin price rise to its previous all-time high around $73,737 in 2024. This pattern shows that the BTC market could be at the beginning of a cyclical behavioral change.
Alphractal said:
A familiar pattern is emerging: alternating cycles of increase and decrease in the Open Interest Delta — what we might call Phase 1 and Phase 2. After a strong buildup of positions (positive Delta), we often see a nearly proportional drop (negative Delta), showing clear cyclical behavior in the market.
Furthermore, Alphractal noted that the 180-day Open Interest Delta offers a more interesting insight into the Bitcoin price trajectory in the coming weeks. According to the market intelligence firm, a negative 180-day OI Delta metric is usually associated with a market bottom or an accumulation trend.
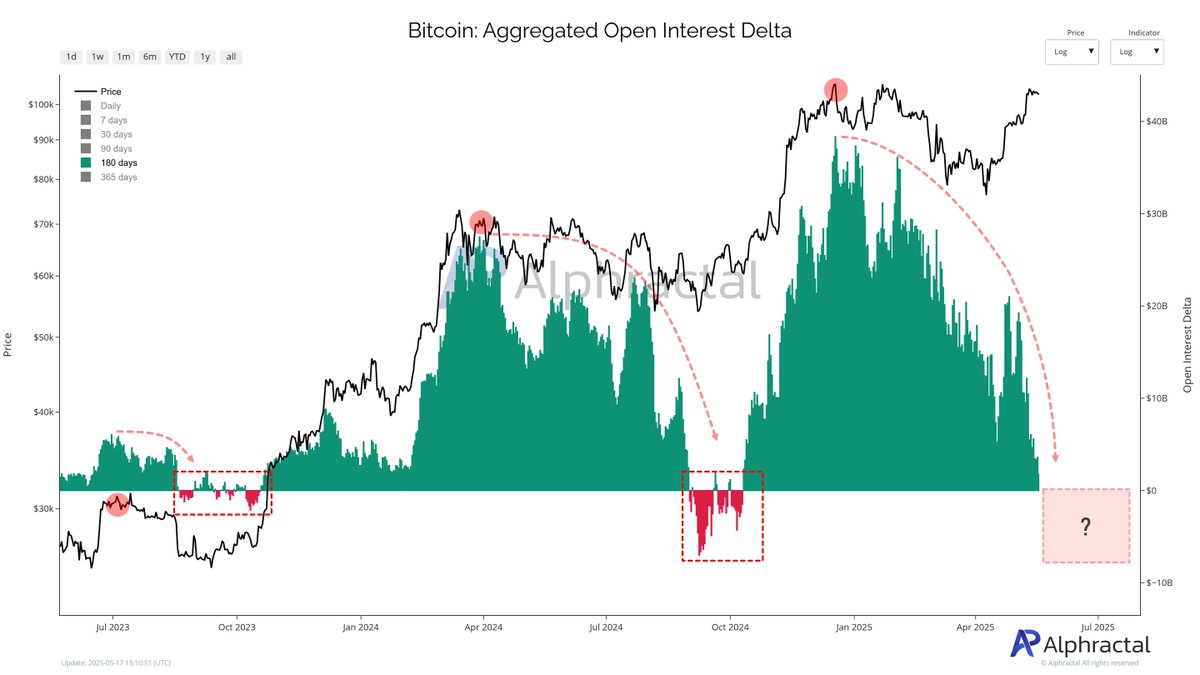
As shown in the chart above, the 180-day Open Interest Delta sits just above the negative territory, which suggests that the Bitcoin price could witness increased volatility in the coming weeks. However, it is worth mentioning that a cross beneath the zero threshold could also signal the start of a new consolidation phase.
Alphractal concluded on X:
Overall, Open Interest has not grown proportionally like it did from October 2023 to early 2024 — and again from October 2024 into early 2025. These yearly patterns may suggest a fractal behavior in investor risk appetite.
Bitcoin Price At A Glance
As of this writing, the price of BTC stands at around $103,367, reflecting a 0.4% decline in the past 24 hours.
Recommended Articles


