




Top Altcoins Price Forecast: Ripple, Solana, and Cardano risk deeper losses
- Ripple edges lower, trading below $1.40 and extending its losses from the previous day.
- Solana hovers above $100, risking a steeper correction below its 20-day EMA support around $99.29.
- Cardano ticks higher, taking support from its 100-day EMA around $0.20.
Ripple (XRP), Solana (SOL), and Cardano (ADA) struggle to extend last month's advance, pointing to moderating buying pressure. The technical outlook for XRP, SOL, and ADA suggests a mild near-term bearish bias as momentum weakens.
Ripple lacks enough upside momentum
Ripple trades around $1.3800 at press time on Thursday, extending losses after a bearish close the previous day. XRP is testing the 100-period Exponential Moving Average (EMA) on the four-hour chart at $1.3760 after slipping below the 50-period EMA at $1.4021, keeping the near-term bias tilted to the downside.
The Relative Strength Index (RSI) hovers around 41 on the four-hour timeframe, crossing below the midline as buying pressure wanes. At the same time, the Moving Average Convergence Divergence (MACD) declines below the zero and signal line, reinforcing the risk of further downside.
The 200-period EMA at $1.3069, supported by the 50% retracement of the $0.9888 to $1.6999 upswing at $1.2964, acts as the immediate demand zone, where buyers could enter to buy the dip. A confirmed bearish close below this zone could extend the decline toward the 23.6% Fibonacci retracement at $1.1236.
Looking up, recovery attempts could face first resistance at the 50-period EMA around $1.4021, ahead of the 78.6% Fibonacci retracement at $1.5137.
Solana could see further weakness
Solana hovers above $100 at press time on Thursday, trading in the red for the fourth consecutive day. Still, SOL maintains a constructive bullish bias, holding well above the 20-, 50-, 100-, and 200-day EMAs, clustered between roughly $86 and $99, reinforcing a medium-term uptrend structure despite the recent pullback from the one-week high.
Momentum is mixed, with the RSI easing to about 58 from overbought territory while the MACD crosses below the signal line, suggesting waning bullish pressure.
The 20-day EMA at $99.29 serves as the immediate support, guarding the downside to the 200-day EMA at $91.45.
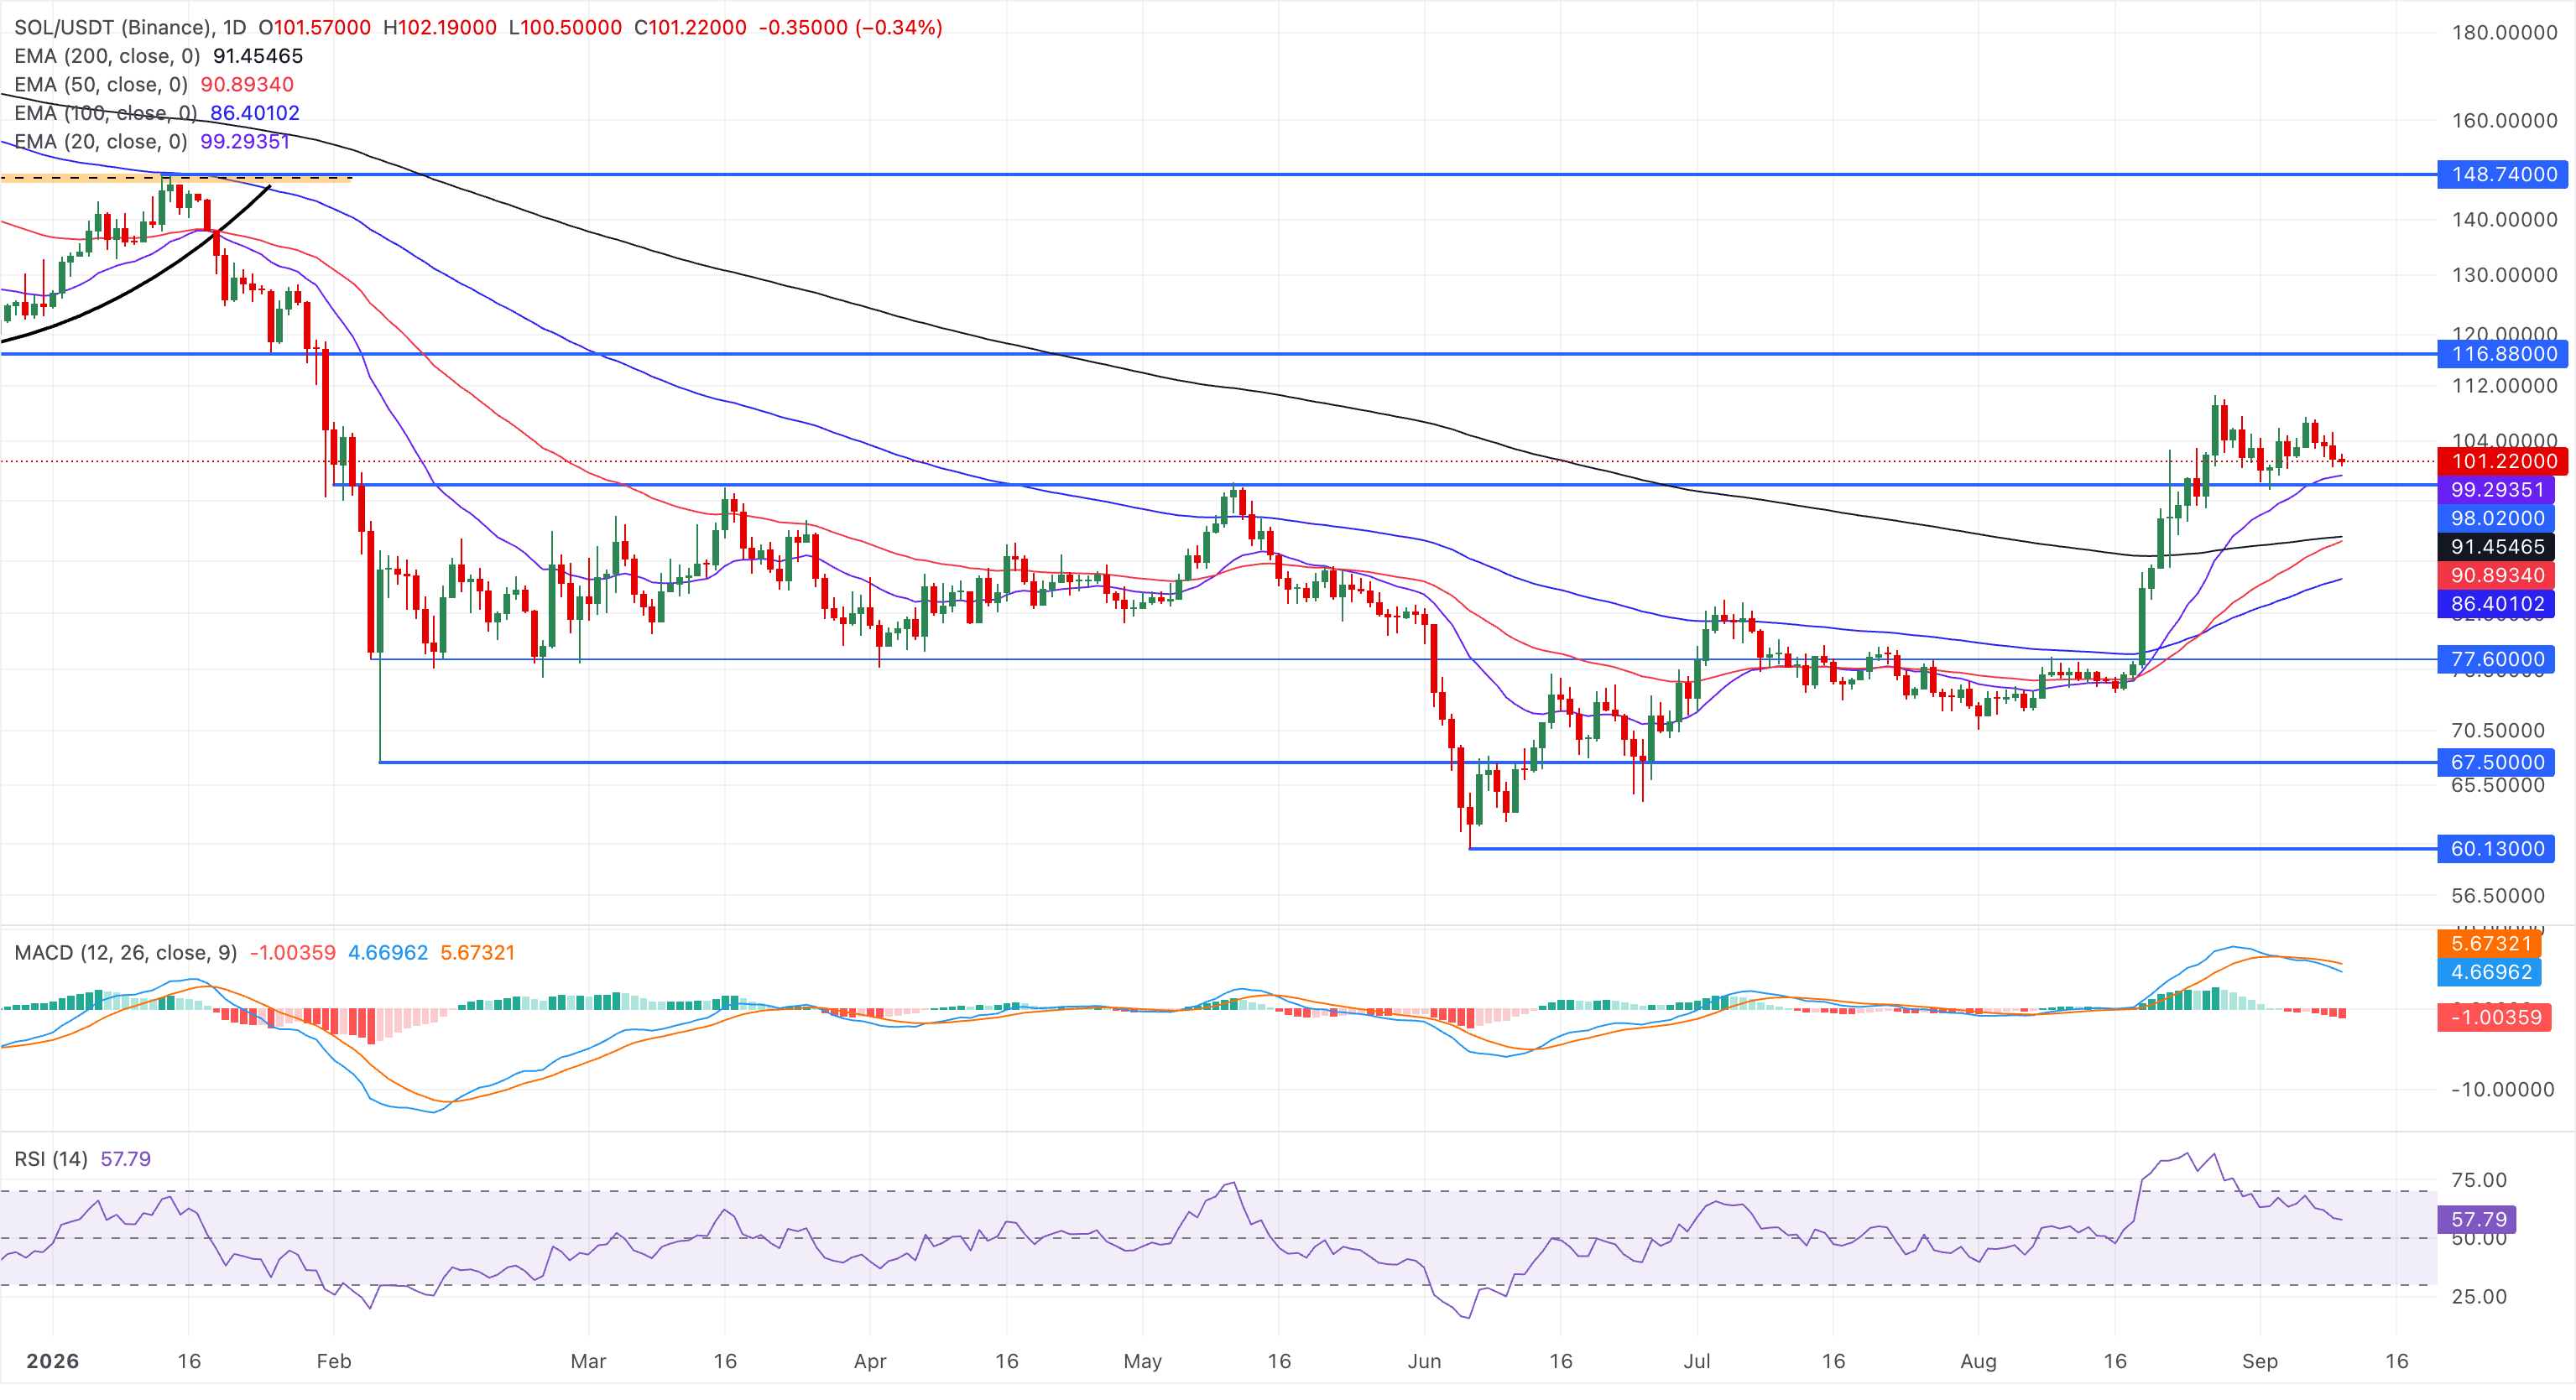
On the topside, the next notable resistance appears at the December 18 low near $116.80, marking a distant structural cap for the broader advance.
Cardano holds at key support
Cardano holds above $0.2100 on Thursday, edging higher after three consecutive days of bearish closes. ADA holds a constructive short-term tone above the 20-, 50-, and 100-day EMAs clustered between $0.19 and $0.21.
The immediate focus is on the 200-day EMA near $0.2446, reinforced by the 78.6% Fibonacci retracement at $0.2467, measured from $0.2887 to $0.1385, which acts as an overhead pivot. A confirmed breakout above this zone could target the Fibonacci anchor at $0.2887.
The RSI around 55 on the daily chart hints at moderate bullish momentum, while the MACD slips slightly below its signal line, suggesting a moderation in the upside momentum.
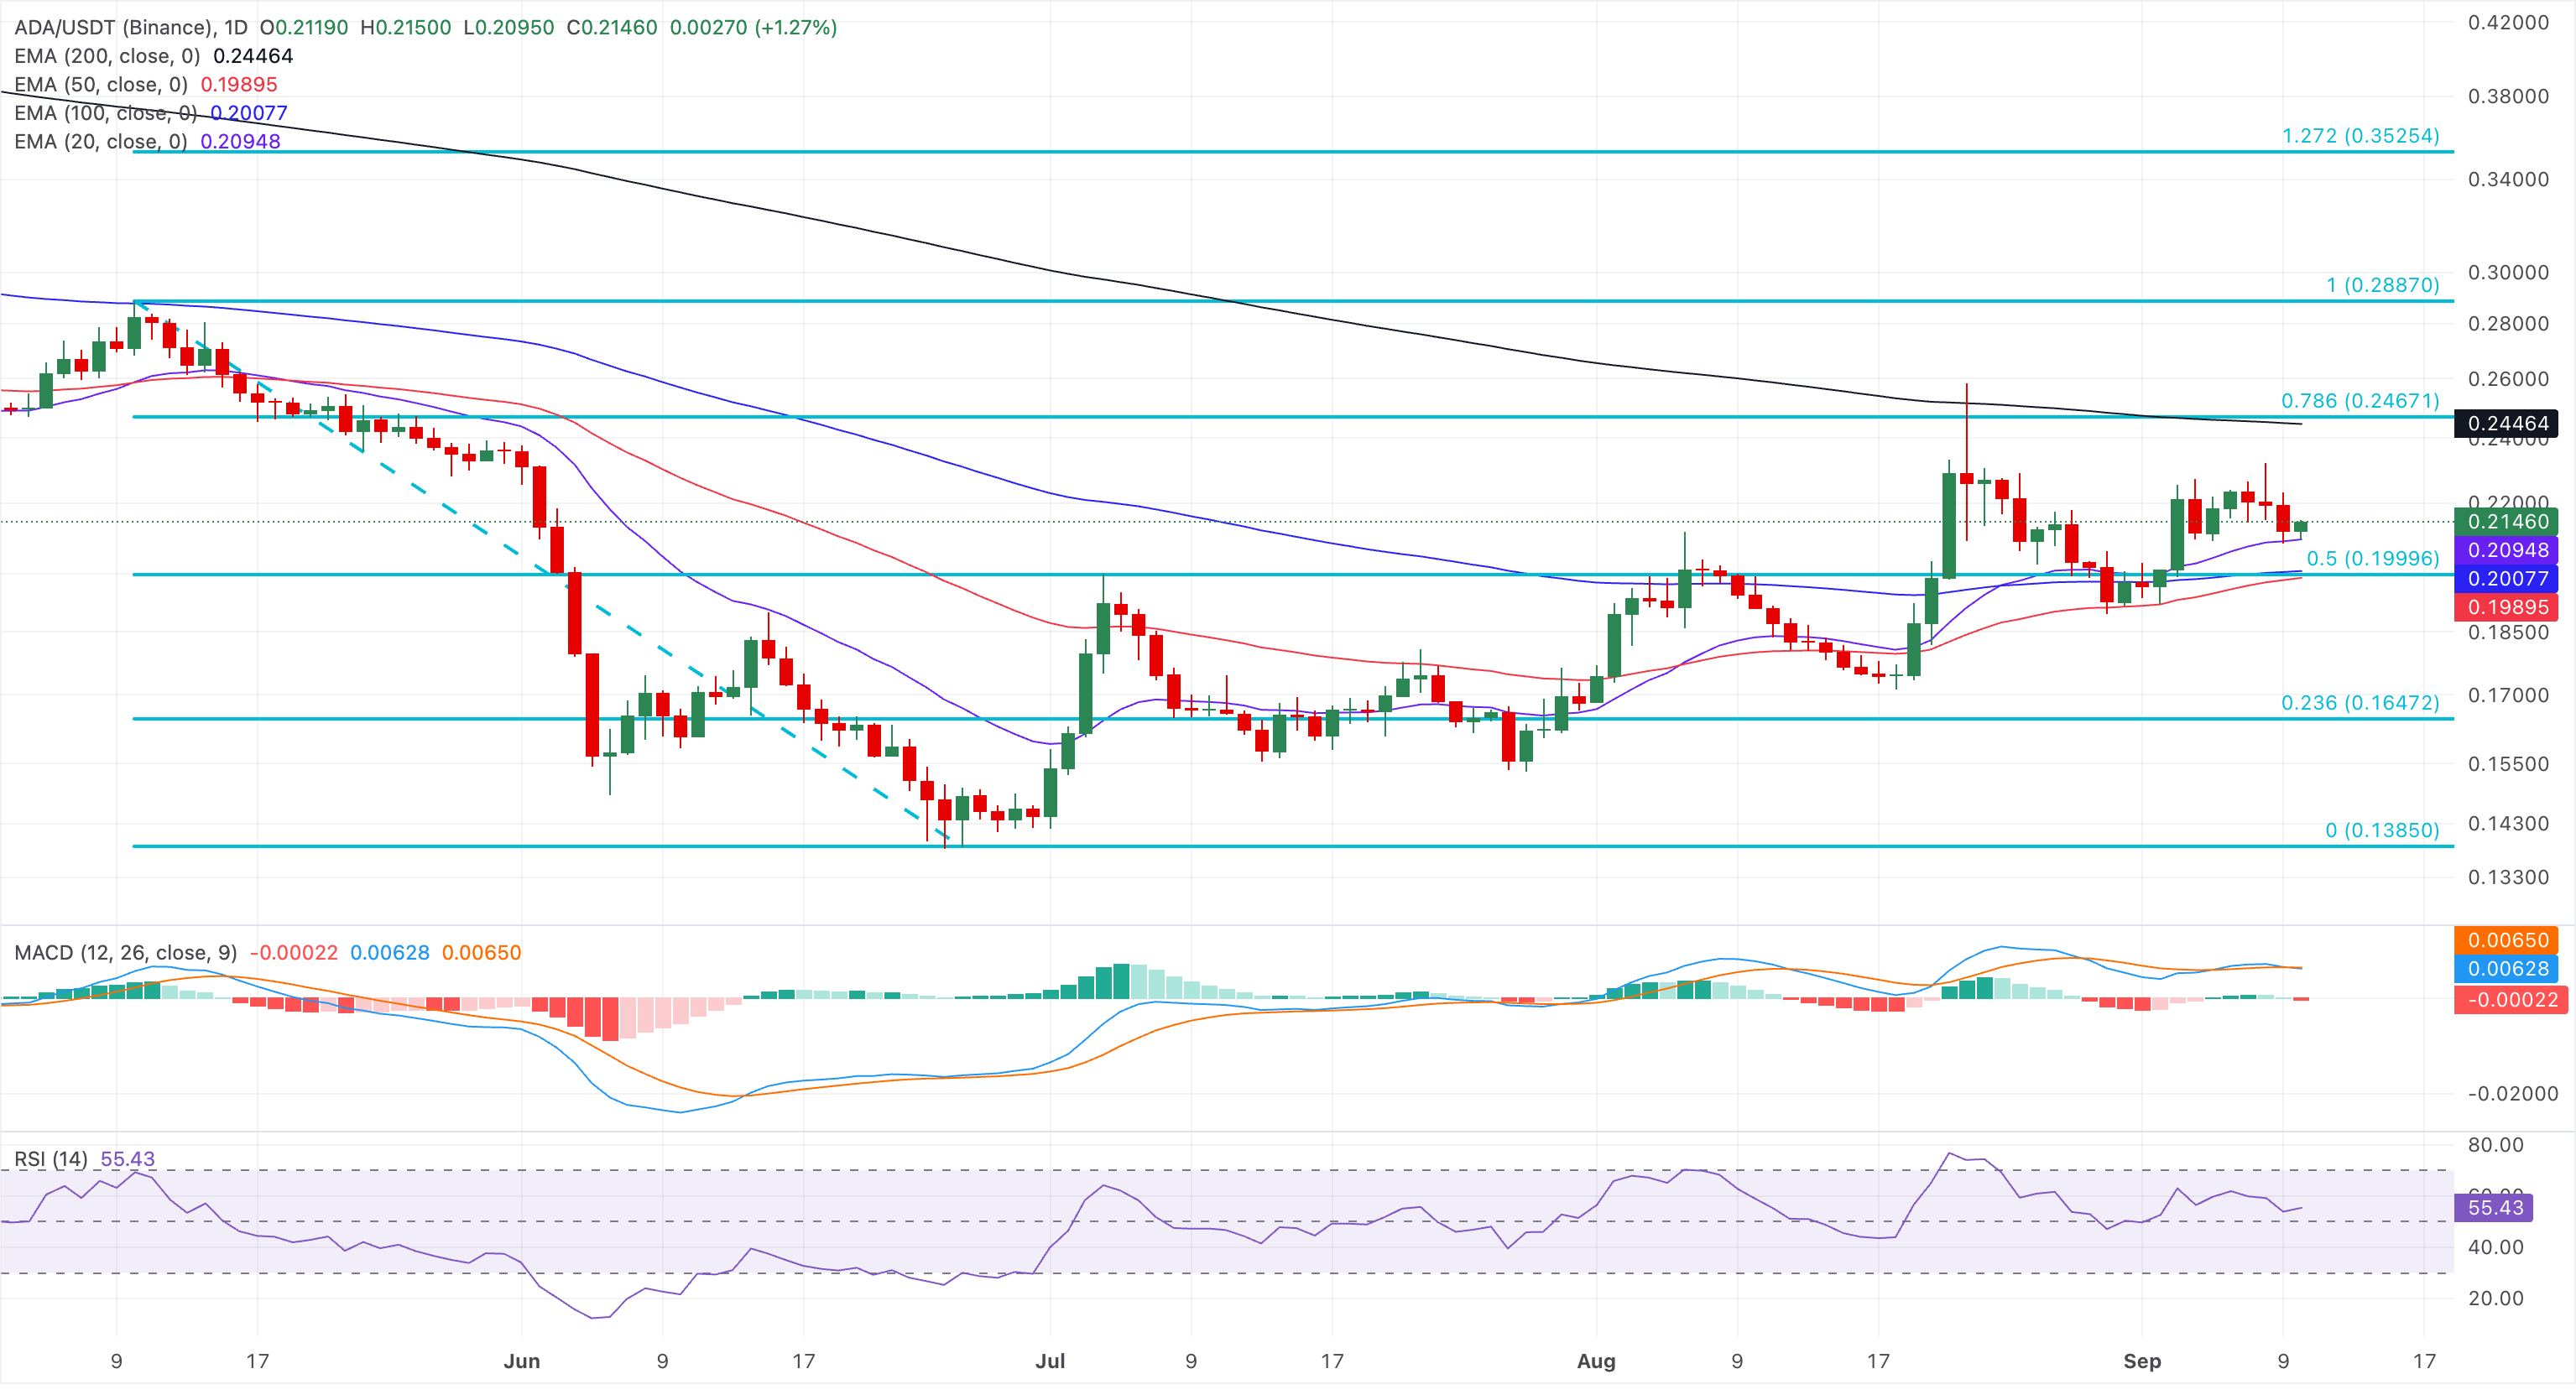
On the downside, immediate support emerges from the 20-day EMA at $0.2094, followed by the cluster of the 100-day EMA at $0.2004, the 50-day EMA at $0.1989, and the 50% retracement level at $0.1999.
(The technical analysis of this story was written with the help of an AI tool. Know more.)
Recommended Articles


