



Solana Price Forecast: Bullish bets, ETF inflows drive SOL recovery

Source Fxstreet
  • Solana trades above $78 on Thursday, gaining nearly 10% so far this week.
  • Derivatives data backs the bullish bias, with long positions climbing to a monthly high and funding rates turning positive.
  • Mild ETF inflows on Wednesday, alongside bullish momentum indicators, support further gains in SOL.

Solana (SOL) extends its recovery, trading above $78 on Thursday, having gained nearly 10% so far this week. The rebound is supported by strengthening derivatives metrics, modest institutional demand and improving technical momentum, all suggesting SOL could extend its gains in the near term.

Strengthening derivatives metrics

Derivatives data for Solana shows bullish bias. CoinGlass long-to-short ratio reads 1.11 on Thursday, the highest level over a month. A ratio above 1 indicates bullish sentiment, as traders bet that asset prices will rally.
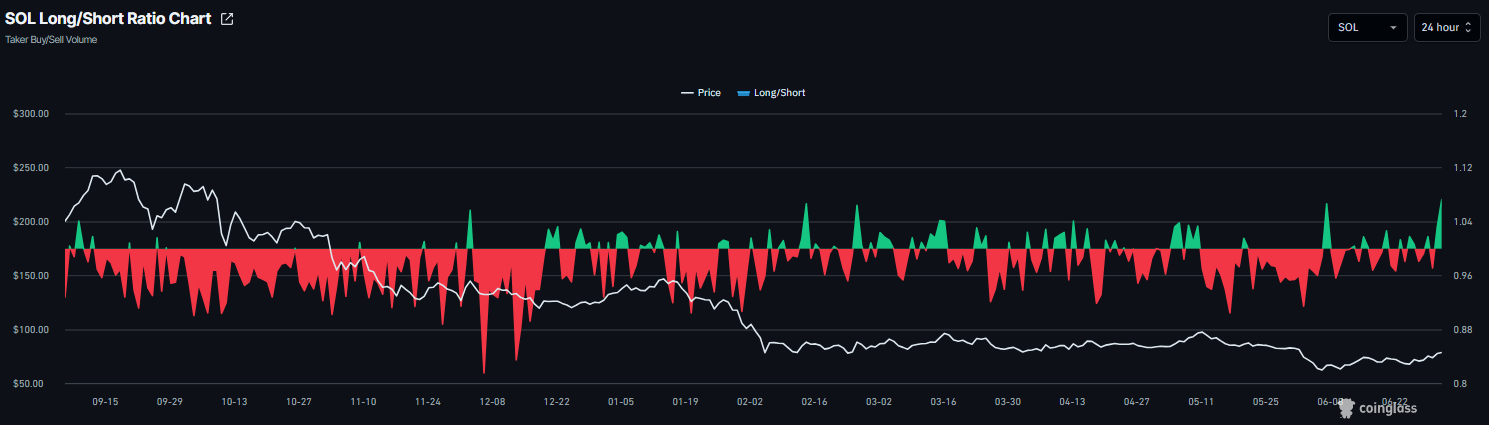
SOL long-to-short ratio chart. Source: Coinglass

In addition, CoinGlass funding rate for SOL turned positive on Thursday, reading 0.0017%, indicating that longs are paying shorts and suggesting bullish sentiment.
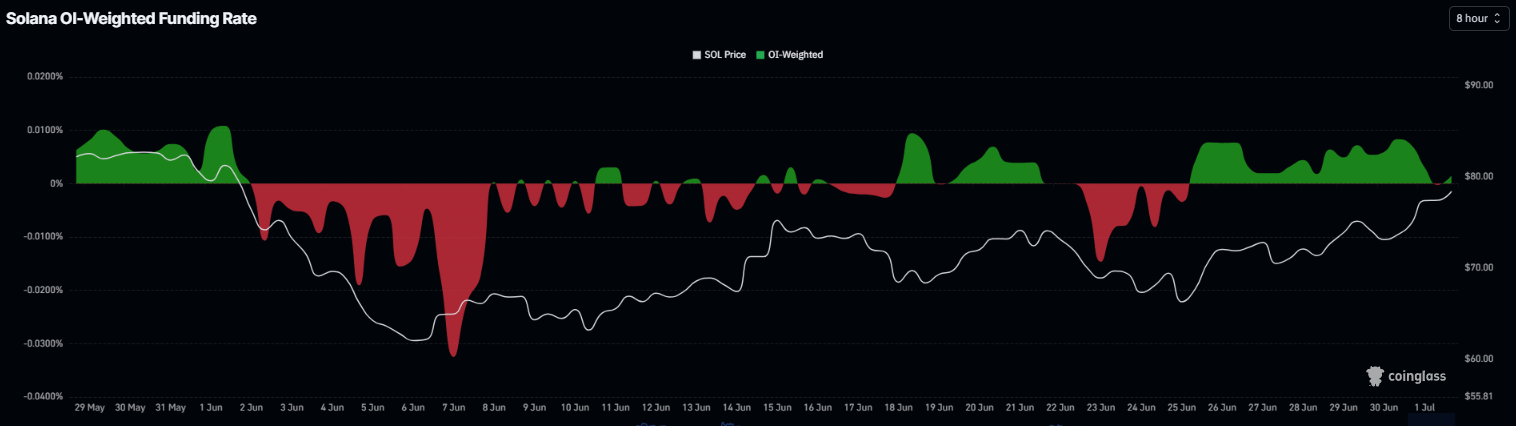
SOL funding rates chart. Source: Coinglass

Return of institutional demand

Institutional demand shows early signs of optimism. SoSoValue data shows that SOL’s spot ETFs recorded an inflow of $521,070 on Wednesday. So far through Wednesday, SOL recorded a net inflow of $3.55 million; if this inflow trend continues and intensifies this week, SOL price could see further upside.
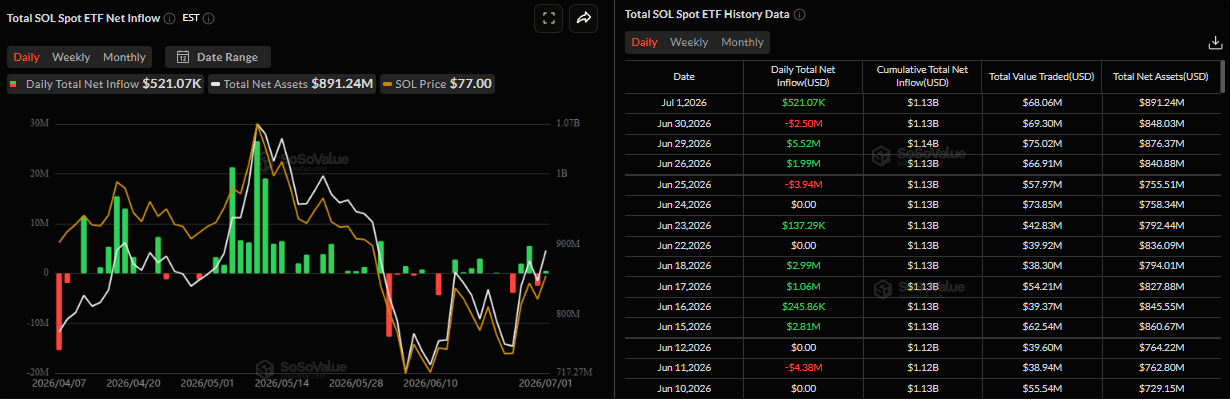
Total SOL spot ETF net inflow daily chart. Source: SoSoValue

Solana Price Forecast: Bullish strength gaining traction

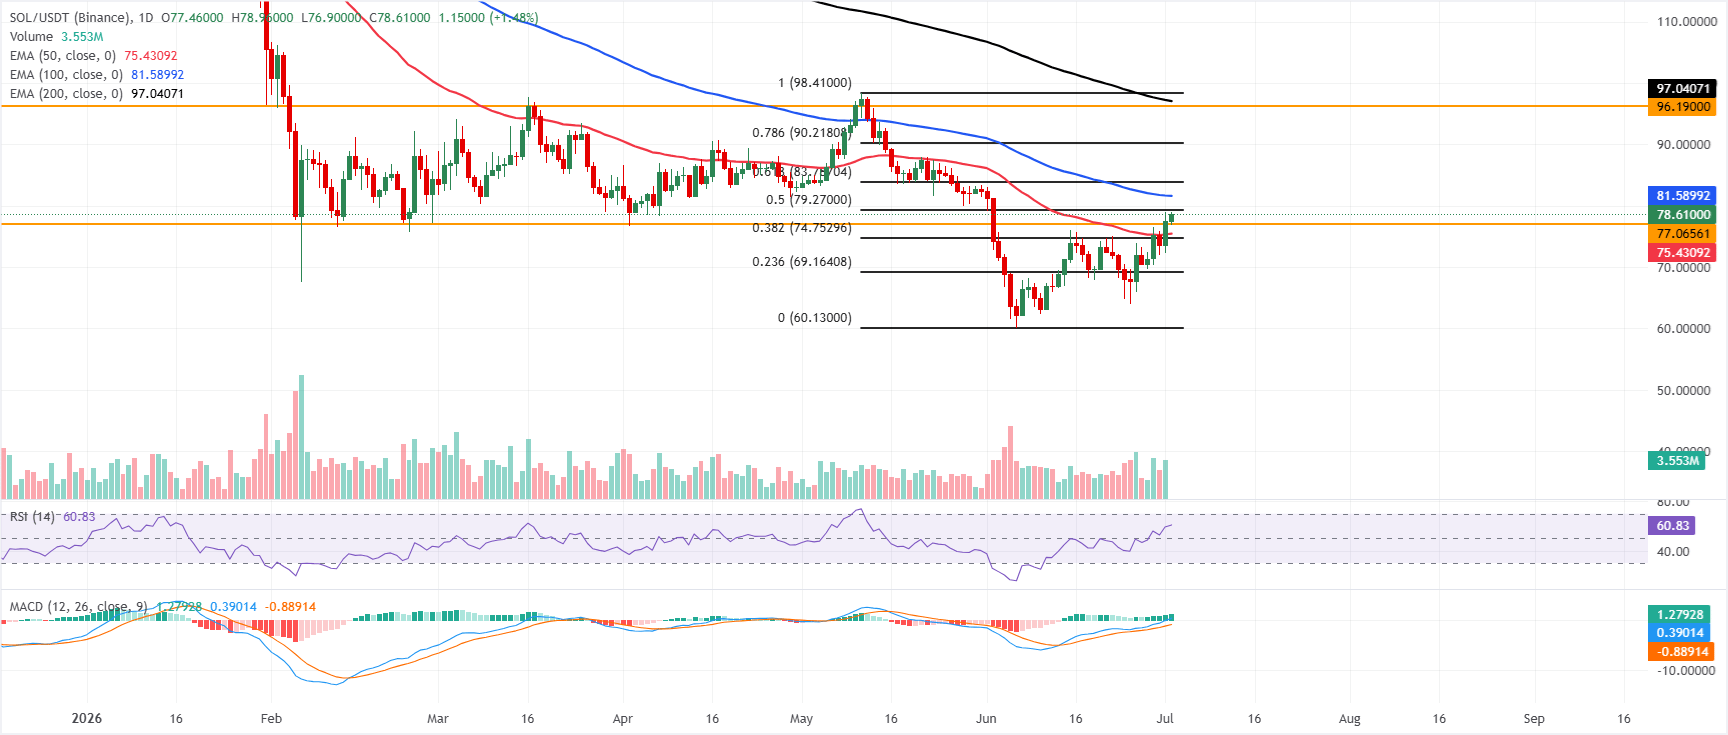
Solana price extends its gains, trading above $78 on Thursday after surging nearly 10% so far this week. However, SOL maintains a cautious tone, trading below the 100-day and 200-day Exponential Moving Averages (EMAs) at $81.58 and $97.04. Meanwhile, SOL holds above the 50-day EMA at $75.43, suggesting some underlying demand, but the 50% retracement of the latest downswing at $79.27 already acts as immediate overhead supply. 

Momentum remains constructive, with the Relative Strength Index (RSI) at 60 and the Moving Average Convergence Divergence (MACD) in positive territory, hinting that while higher EMAs cap the broader trend, buyers retain short-term traction.

On the topside, initial resistance stands at the 50% retracement at $79.27, followed by the 100-day EMA at $81.58 and the 61.8% Fibonacci retracement at $83.79. Above these, a stronger barrier emerges at the 78.6% Fibonacci retracement near $90.22, ahead of the horizontal resistance at $96.19 and the 200-day EMA at $97.04. 

On the downside, immediate support is seen at the horizontal level around $77.07, with the 50-day EMA at $75.43 and the 38.2% Fibonacci retracement at $74.75 forming a secondary demand zone; a deeper pullback would expose the 23.6% Fibonacci retracement at $69.16.
(The technical analysis of this story was written with the help of an AI tool.)

Disclaimer: For information purposes only. Past performance is not indicative of future results.
placeholder
Why are prediction market traders suddenly bearish on Nvidia's stock?Nvidia (NASDAQ: NVDA) stock is still green for 2026, but the trade no longer looks clean from the company that outperformed every other company and country in 2024 and 2025. NND is up about 12% this year, yet they have slipped roughly 3% over the past month. The gap with the rest of the chip...
Author  Cryptopolitan
Jun 23, Tue
Nvidia (NASDAQ: NVDA) stock is still green for 2026, but the trade no longer looks clean from the company that outperformed every other company and country in 2024 and 2025. NND is up about 12% this year, yet they have slipped roughly 3% over the past month. The gap with the rest of the chip...
placeholder
Why Did Nvidia Stock Fall on Monday Despite a $500 Billion Wall Street AI Deal?Nvidia (NVDA) sells the chips powering the artificial intelligence (AI) boom. Now it is helping raise the money that buys them. A reported $500 billion financing package with six Wall Street giants wo
Author  Beincrypto
14 hours ago
Nvidia (NVDA) sells the chips powering the artificial intelligence (AI) boom. Now it is helping raise the money that buys them. A reported $500 billion financing package with six Wall Street giants wo
placeholder
SpaceX Stock Finally Breaks Out of a 30-Day Price Dump, Will It Last?SpaceX (SPCX) stock traded back above its $135 IPO price on Monday for the first time in nearly a month. Shares changed hands near $138, up more than 4%, according to TradingView data.Two forces colli
Author  Beincrypto
14 hours ago
SpaceX (SPCX) stock traded back above its $135 IPO price on Monday for the first time in nearly a month. Shares changed hands near $138, up more than 4%, according to TradingView data.Two forces colli
placeholder
JPMorgan and CFRA Raise S&P 500 Price Forecast as Nobody Wants to Hedge AnymoreJPMorgan raised its year-end S&P 500 target to 8,000 on Monday, and research firm CFRA now sees 8,050. A new stock market risk is forming beneath the cheer, as investors abandon their downside hedges.
Author  Beincrypto
14 hours ago
JPMorgan raised its year-end S&P 500 target to 8,000 on Monday, and research firm CFRA now sees 8,050. A new stock market risk is forming beneath the cheer, as investors abandon their downside hedges.
placeholder
America Helped Save the Yen, The Market Just Took It Back, and Bitcoin Is ExposedUSD/JPY climbed to 158.93 on Monday, its highest level this month. Just 10 days ago, Japan’s nearly $88 billion yen intervention had dragged the pair down from 164.The yen is once again August’s weake
Author  Beincrypto
14 hours ago
USD/JPY climbed to 158.93 on Monday, its highest level this month. Just 10 days ago, Japan’s nearly $88 billion yen intervention had dragged the pair down from 164.The yen is once again August’s weake
Related Instrument
goTop
quote