


Pi Coin Takes A Bearish Hit —But Early Relief Metrics Hint At A Comeback
Pi Coin has dropped about 7% in the last 24 hours, joining the wider market pullback. Even with this hit, its monthly move is still near –8.7%, which is better than Bitcoin’s roughly 21% loss and Ethereum’s 26% slide over the same period.
The question now is simple: is this the start of a deeper drop, or just a reset before PI’s next upmove?
A Fresh Bearish Shock, Then Two Metrics Hint The Dump Might Be Easing
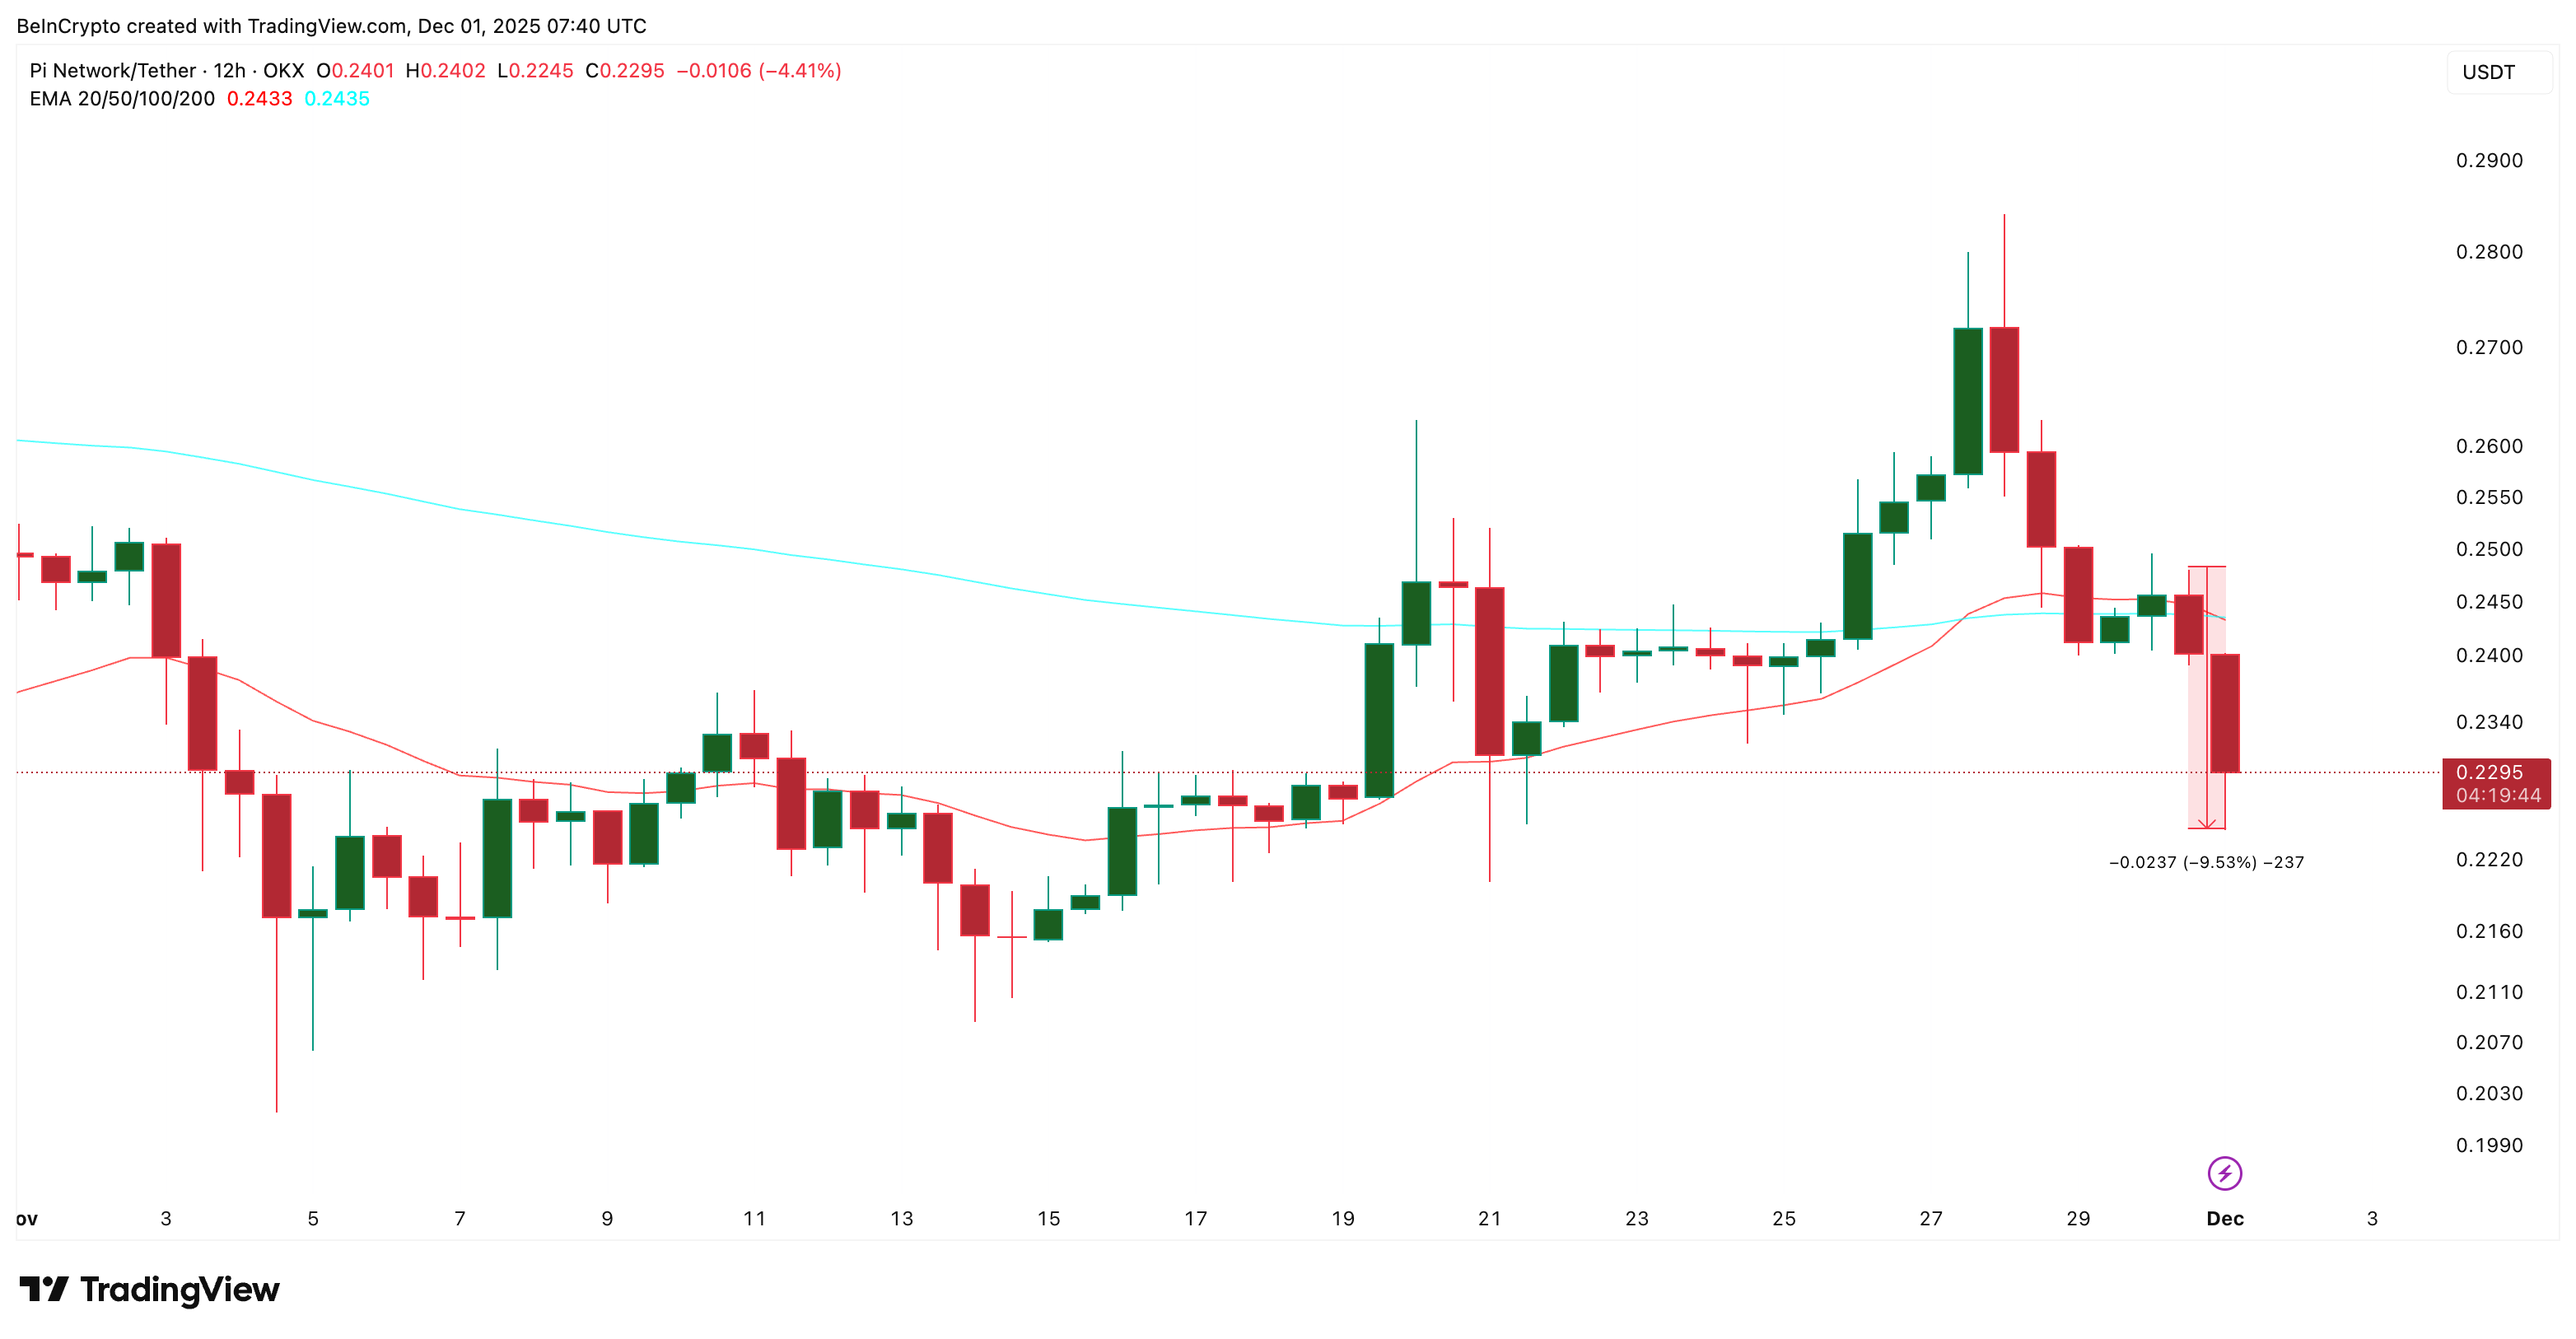
The latest leg down started with a clear bearish event on the 12-hour chart. PI completed a downside crossover where the 20-period exponential moving average (EMA) slipped below the 100-period EMA. EMA is a moving average that gives more weight to recent prices so traders can see short-term momentum more clearly.
 Bearish Weakness: TradingView
That crossover usually keeps pressure on price in the short term, which is what we have just seen with the 7% daily loss and a near 10% loss from yesterday’s high.
But under the surface, two internal metrics now suggest that the worst of this wave may be close to done.
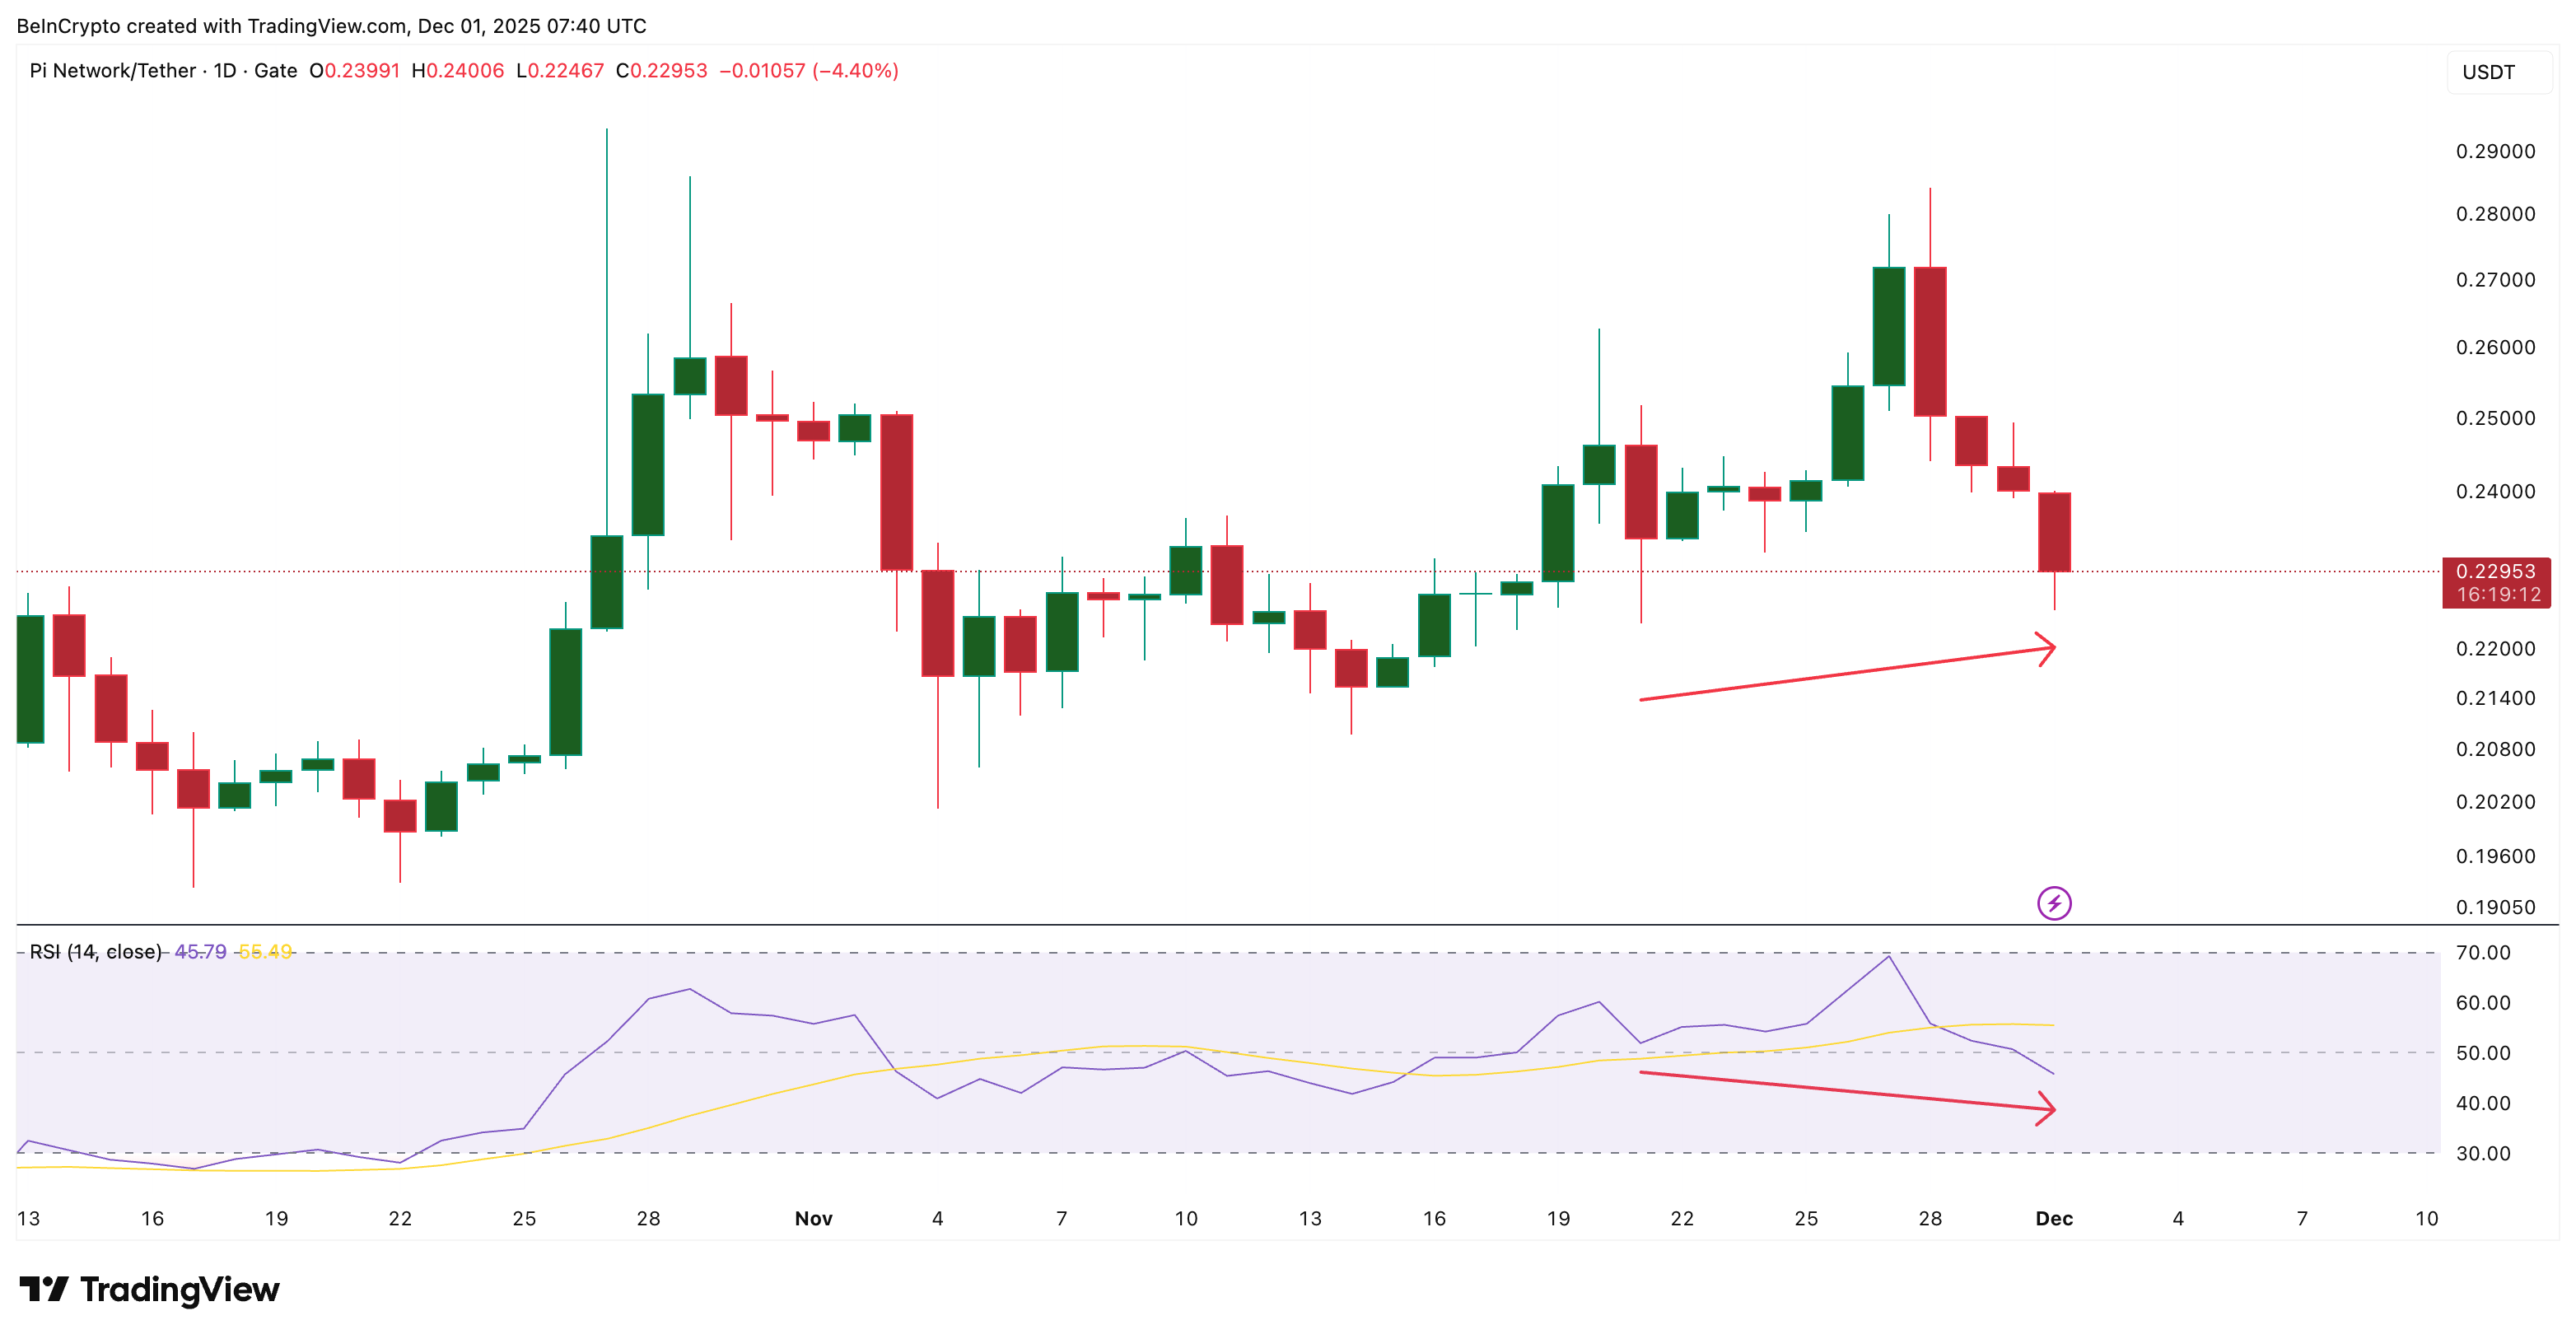
The first is the Relative Strength Index (RSI), which measures momentum. Between November 21 and December 1, PI’s price formed a higher low, but RSI formed a lower low. This is a hidden bullish divergence. It often appears when a trend still wants to push higher after a shake-out.
 RSI Divergence: TradingView
However, the RSI is still not in the complete oversold zone and might end up dropping a bit more before recovering, along with the price.
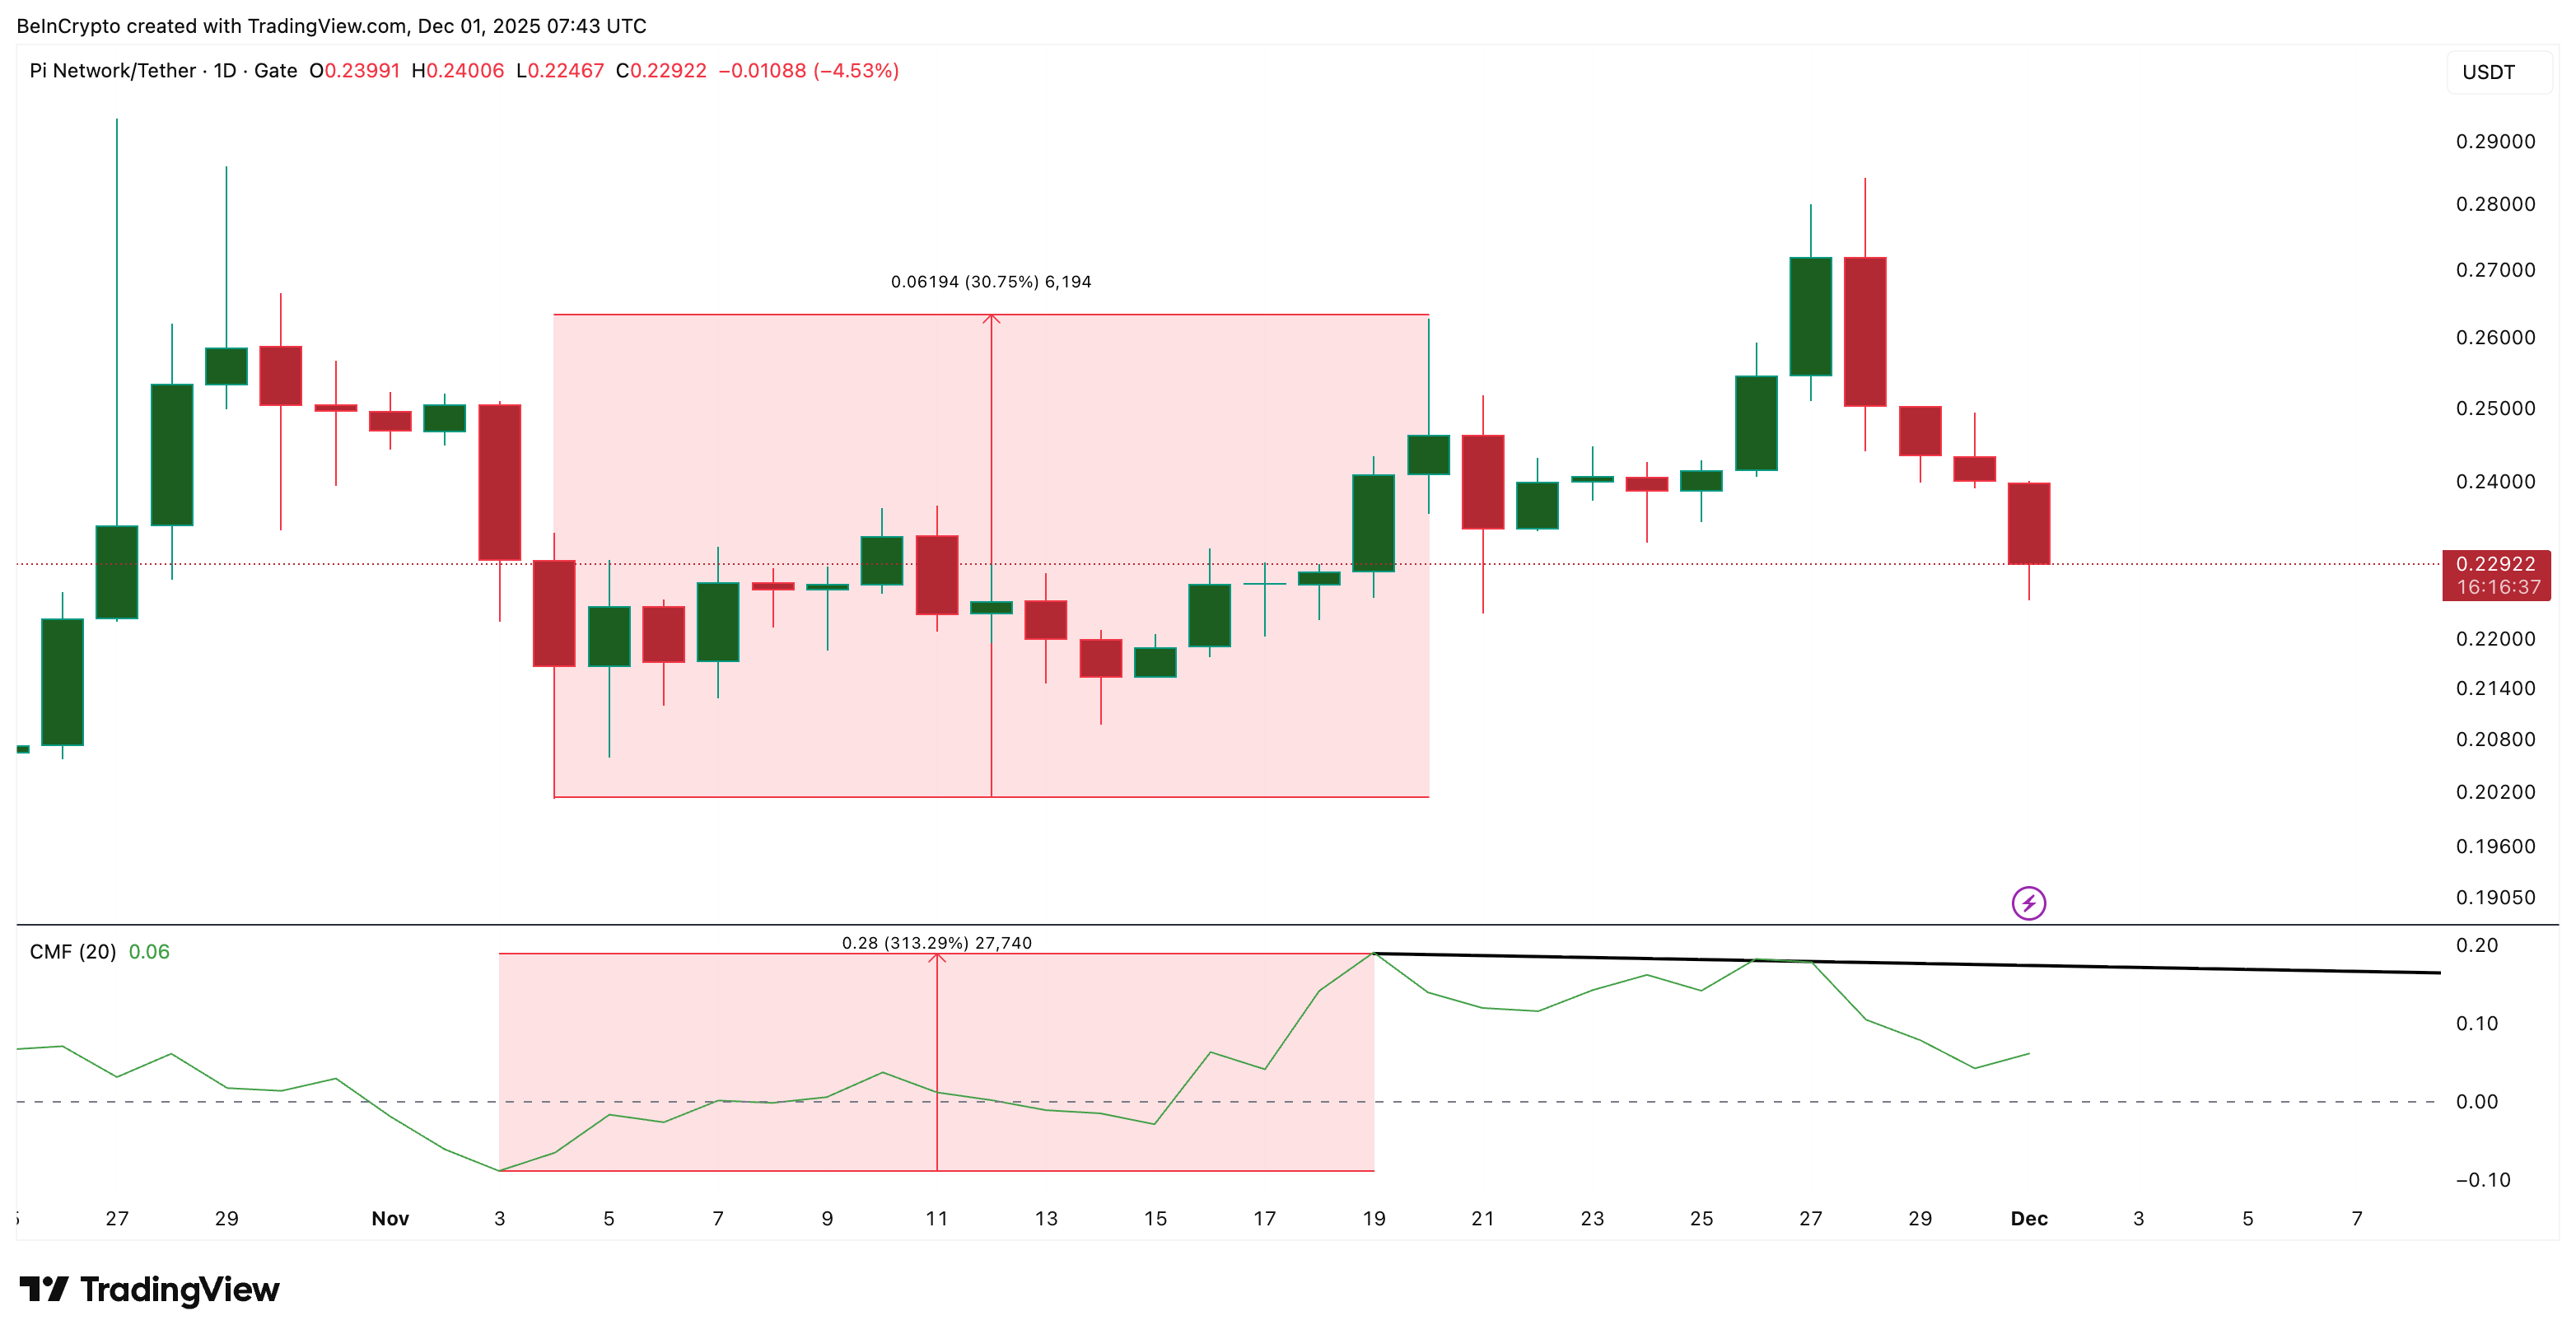
The second clue comes from Chaikin Money Flow (CMF), which tracks whether big-money buyers or sellers are in control. CMF has a strong record with PI. From November 3 to November 19, CMF jumped more than 313%. During almost the same window, from November 4 to November 20, the Pi Coin price climbed about 30.75%. When CMF surged, the price followed quickly after.
 Pi Coin Needs Big Money: TradingView
Right now, CMF is still above zero and has started to curl higher again. CMF has to break above the descending trend line that connects its recent lower highs. If that breakout happens while RSI holds its divergence, the setup supports a more meaningful rebound.
Key Pi Coin Price Levels That Will Confirm Or Kill The Rebound Case
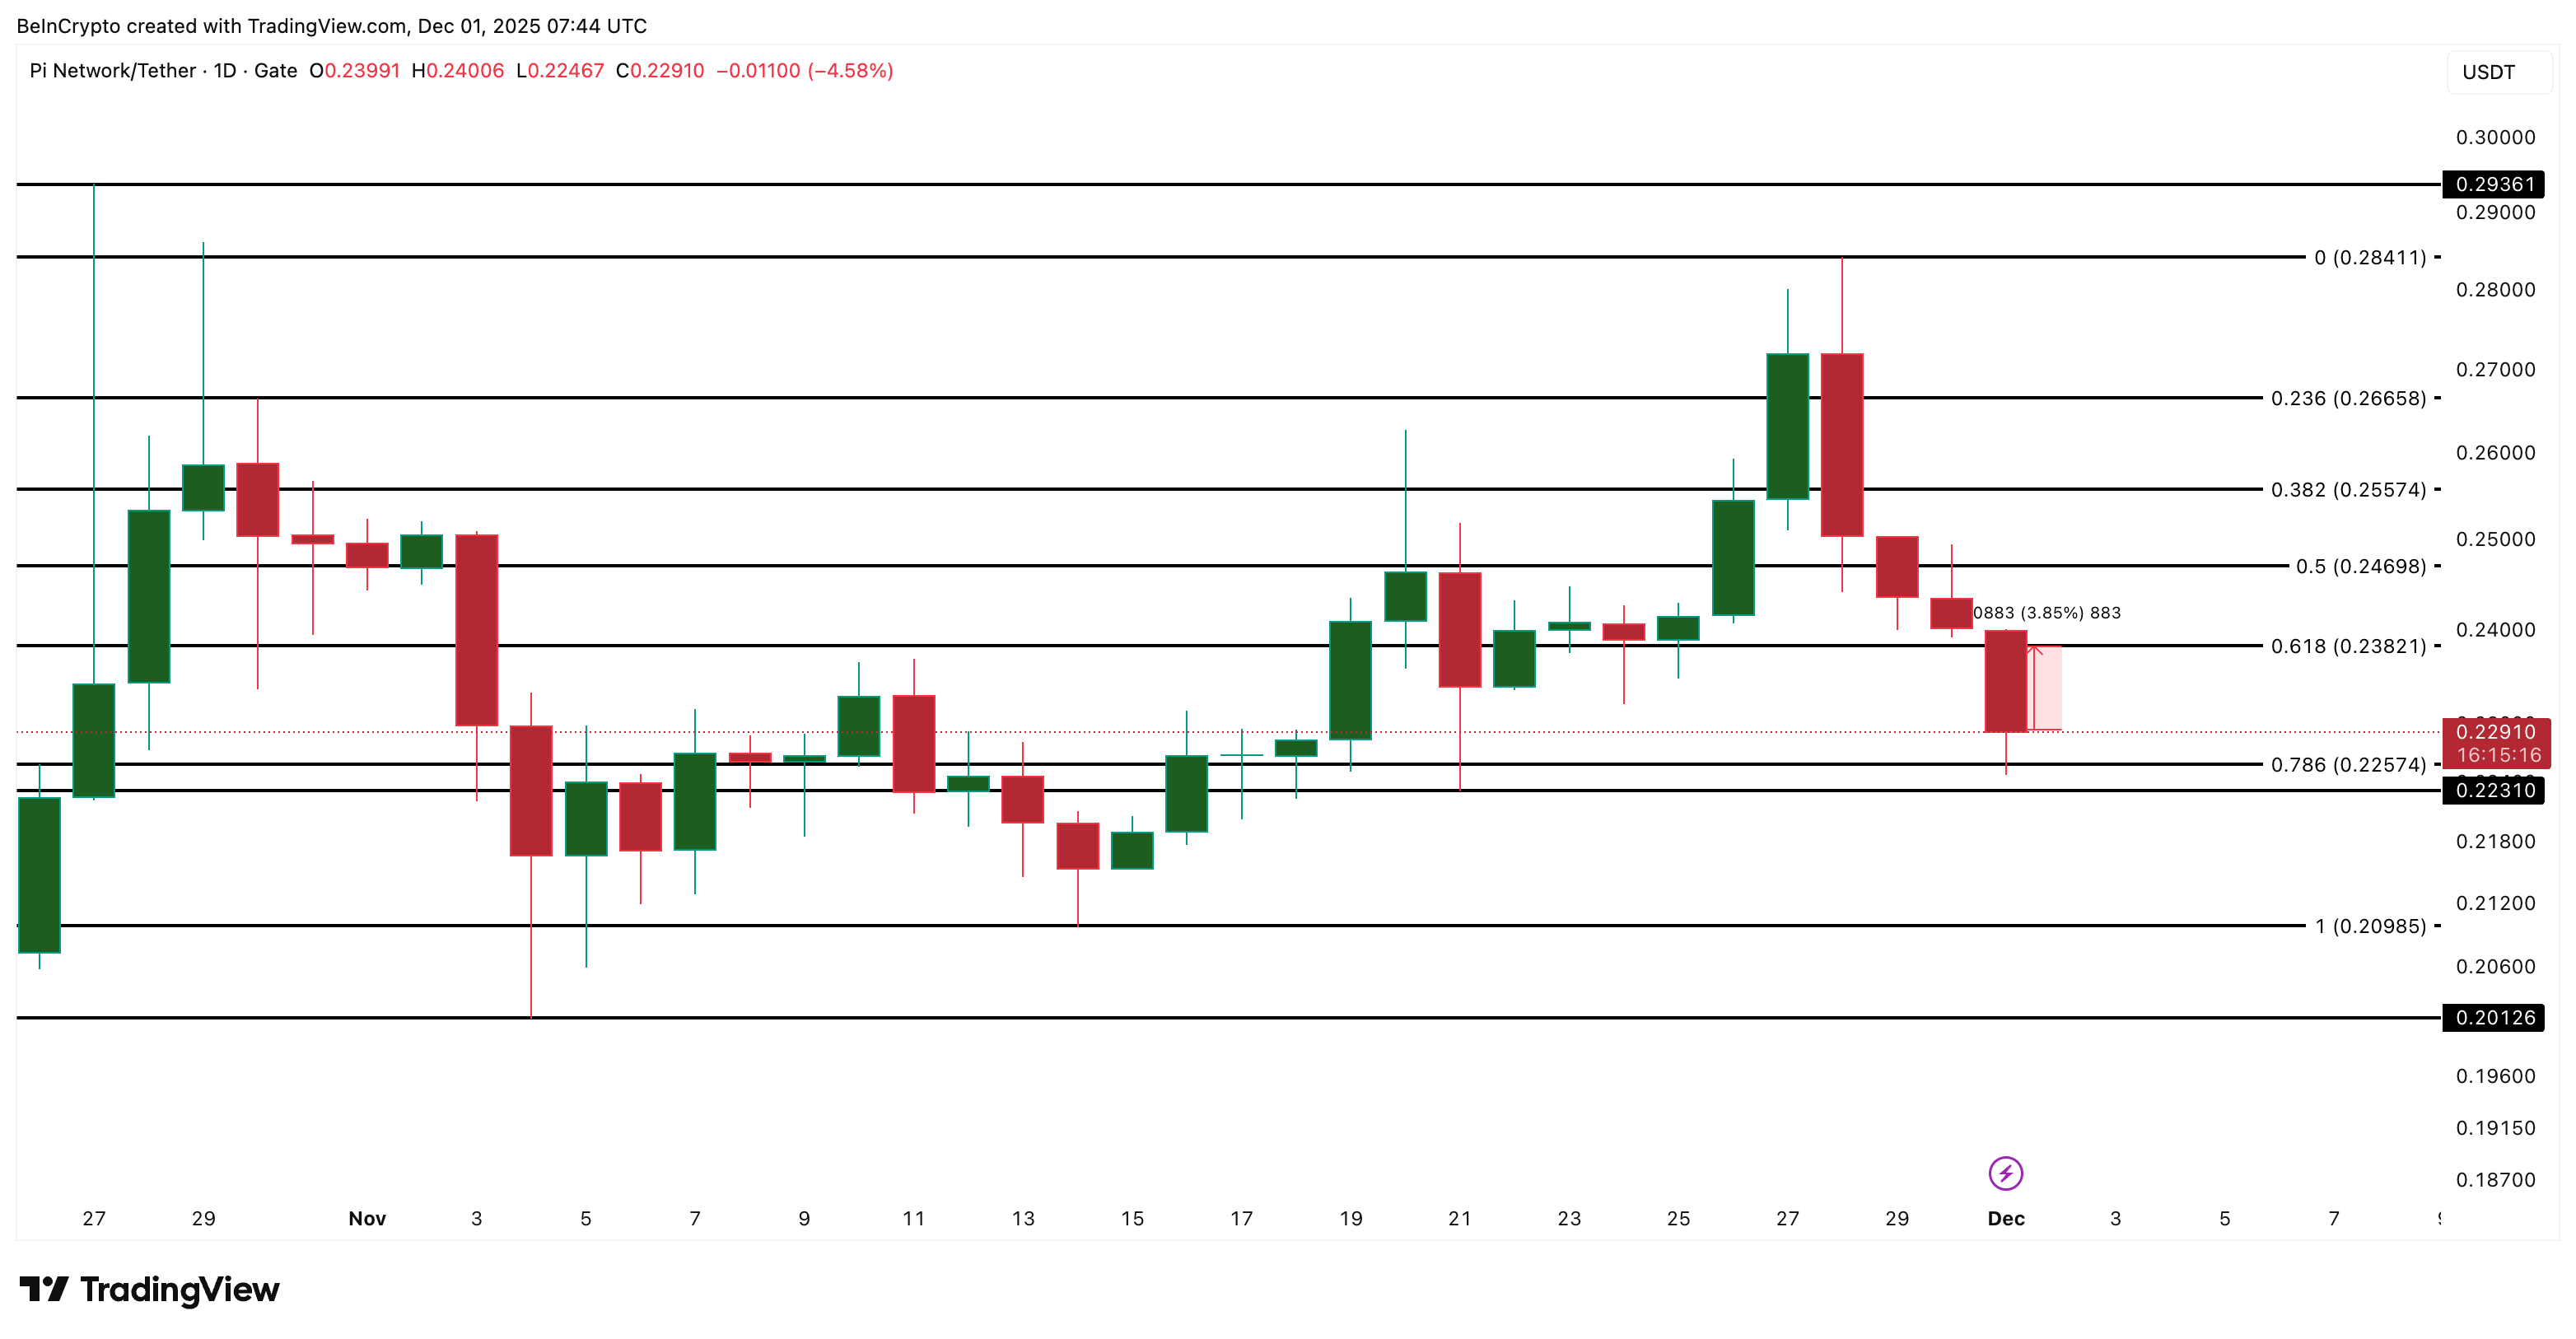
If PI buyers can build on this early internal strength, the first job is to reclaim $0.238 with a clean daily close. From the current zone near $0.229, that would be roughly a 4% rebound.
A close above $0.238 opens the door to the next resistance areas near $0.255 and $0.266. If the broader market improves, the Pi Coin price could even retest $0.284, which marked the top of the last strong move up.
On the downside, PI must protect support around $0.225 and $0.223. Losing both levels would cancel the hidden bullish divergence and shift focus to the next demand area near $0.209.
 Pi Coin Price Analysis: TradingView
Want more token insights like this? Sign up for Editor Harsh Notariya’s Daily Crypto Newsletter here.
Right now, Pi Coin has taken a clear hit after the bearish EMA crossover, but it is still holding up better than Bitcoin and Ethereum on a monthly view. RSI divergence and a curling CMF say the current dump might be closer to the end than the beginning.
Whether that turns into a real rebound or just a brief pause comes down to two simple tests: CMF breaking its trend line and PI closing back above $0.238 without losing $0.223 on the way.
Recommended Articles


